ARCHIVED - Energy Trade - Energy Facts
This page has been archived on the Web
Information identified as archived is provided for reference, research or recordkeeping purposes. It is not subject to the Government of Canada Web Standards and has not been altered or updated since it was archived. Please contact us to request a format other than those available.
ISSN 1925-2706
Energy Trade - Energy Facts [PDF 19594 KB]

July 2011
Canada is endowed with an abundance of energy resources. It has enough crude oil, petroleum products, electricity, natural gas and natural gas liquids (NGLs) to meet its domestic needs as well as excess supplies available for export.
Canada exports a significant amount of energy and this generates revenue for the country. The following are some interesting facts about Canada's energy trade.
Canadian Exports of Energy
In 2010:
- Total Canadian merchandise exports were valued at $405 billion; energy exports[1] were valued at $94 billion or 23 per cent of total merchandise exports (Figure 1).[2]
- The energy sector accounted for approximately 6.7 per cent of Canada's Gross Domestic Product (GDP) in 2010.[3]
- Declining prices and the effect of the North American recession resulted in a slip for energy from first position in 2008 to second spot (Figure 2).
Figure 1: Energy Products Exports vs Total Merchandise Trade Exports
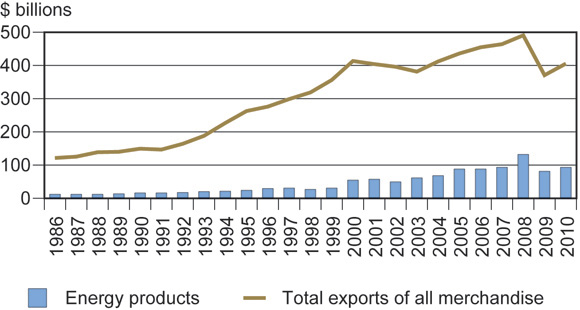
Source: Statistics Canada
Figure 2: Top Merchandise Exports
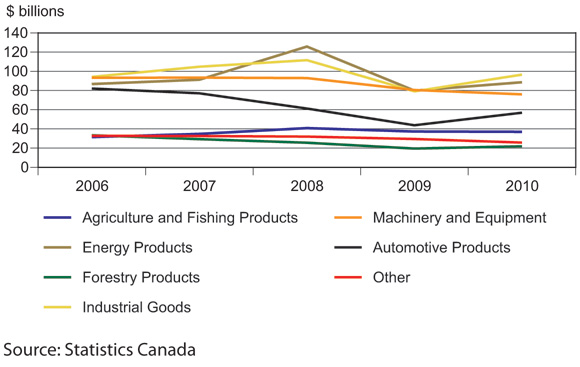
Source: Statistics Canada
[1] Includes crude petroleum, natural gas, coal and other bituminous substances, petroleum and coal products and electricity.
[2] Statistics Canada (values in current dollars).
[3] Statistics Canada
Canadian Imports of Energy
In 2010:
- Total Canadian merchandise imports (which is the sum of the components of Figure 3) were valued at $413 billion; energy imports were valued at $40 billion or roughly ten per cent of total merchandise imports (Figure 3).[4]
- Merchandise imports from the U.S. were valued at $203 billion or roughly 50 per cent of total merchandise imports.[5]
- Energy imports from the U.S. were valued at $12 billion or 30 per cent of total energy imports.[6]
- Canada imports energy in some regions because domestic supplies are not accessible or are more expensive.
Figure 3: Top Merchandise Imports
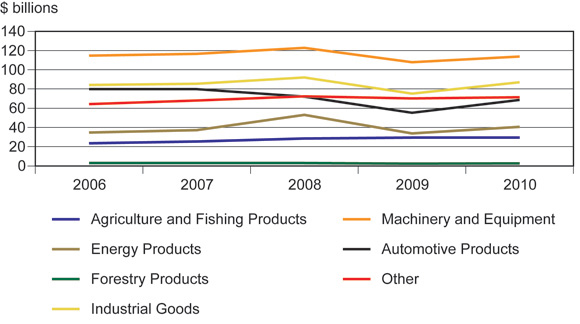
Source: Statistics Canada
[4] Statistics Canada (values in current dollars).
[5] Ibid.
[6] Ibid.
Canada's Top Energy Exports
- In 2009, natural gas exports were the leading Canadian energy export in terms of volume, followed by crude oil, refined petroleum products, NGLs and primary electricity.
- Historically, natural gas was the most valuable energy export for Canada. In 2007, this changed with crude oil, petroleum products and coal products taking the lead. This has been the case for the last three years (Figure 4).
- Canada is one of the few developed economies that is a net exporter (exports are larger than imports) of energy with the gap between exports and imports growing (Figure 5).
Figure 4: Net Energy Export Revenue (Exports minus Imports)
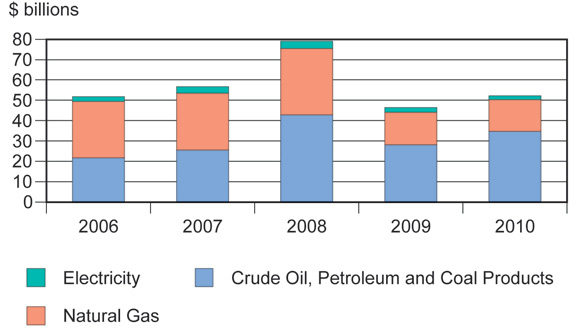
Source: Statistics Canada
Figure 5: Energy Products Exports vs Energy Products Imports
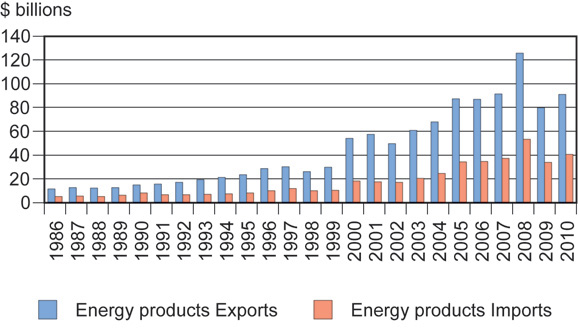
Source: Statistics Canada
Crude Oil
In 2010:
- Almost all Canadian crude oil exports were delivered to U.S. destinations referred to as PADDs (Petroleum Administration for Defence Districts), with small volumes sent to other regions of the world (Figure 6).
- Canada ranks first in crude oil and petroleum product exports to the U.S. Exports of crude oil from Canada represented 22 per cent of U.S. crude oil imports.[7]
- Canada exported 308 200 cubic metres per day (m³/d) (1.9 million barrels per day (bbl/d) of crude oil to the U. S. primarily to refineries in the U.S. Midwest (PADD II) (Figure 6).
- Gross crude oil export revenues were estimated at $50 billion in 2010 compared with $40 billion in 2009.[8]
- Canada imported 123 500 m³/d (778 thousand bbl/d) of crude oil from countries such as: Algeria, United Kingdom, Nigeria, Norway, Saudi Arabia and other countries.[9]
Figure 6: 2010 Crude Oil Supply and Destination (thousand m³/d)
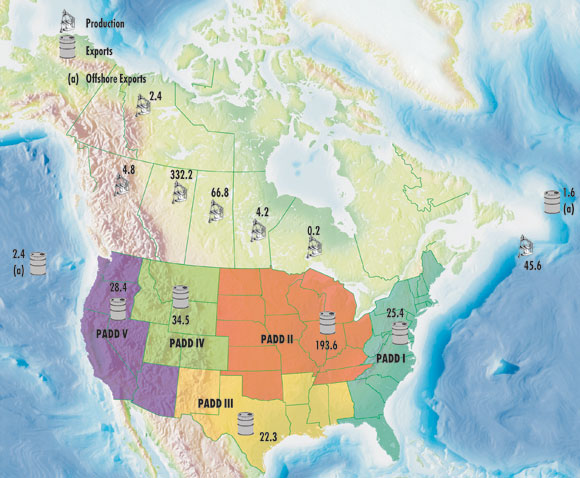
Source: NEB, Statistics Canada
[7] Energy Information Administration (EIA).
[8] NEB estimate. The revenue is calculated by taking total gross crude oil exports and multiplying it by the average crude oil price for the year.
[9] Statistics Canada. Others include Iraq, Venezuela, Mexico and the U.S.
Natural Gas
In 2010:
- Canada ranked first as a supplier of natural gas exports to the U.S. (Figure 7).
- Canadian natural gas exports represented 14 per cent of estimated U.S. consumption;[10] this has declined slightly over the past few years as U.S. domestic production, led by shale gas, has increased.
- Total Canadian natural gas exports were approximately 253.2 million m³/d (9 billion cubic feet per day (Bcf/d) (Figure 7).
- Gross natural gas export revenues were approximately $15 billion compared with almost $16 billion in 2009.[11] While volumes were essentially the same, the drop in revenue was due to lower natural gas prices and the rising value of the Canadian dollar compared with the American dollar[12].
- Canada imported natural gas from the U.S., primarily into Ontario. Imported volumes are much smaller than exported volumes. Canada imported roughly 56.1 million m³/d (2 Bcf/d) of natural gas from the U.S. and roughly 5.8 million m³/d (0.2 Bcf/d) of liquefied natural gas (LNG) from overseas (Figure 7)
Figure 7: 2010 Natural Gas Supply and Disposition
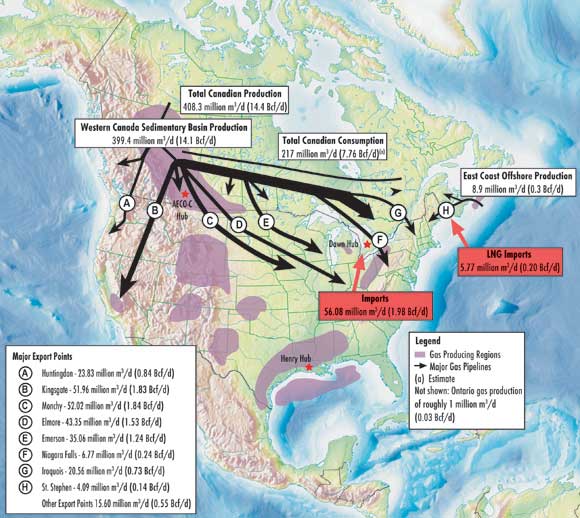
Source: NEB
[10] In 2010, U.S. consumption was 1 873 million m³/d (66.12 Bcf/d), Canadian exports were 253.2 million m³/d (9 Bcf/d). (Energy Information Administration (EIA). For further information visit: Natural Gas Monthly
[11] NEB estimate is calculated by taking total gross natural gas exports and multiplying it by the average natural gas price for the year.
[12] Natural gas is priced in U.S. dollars. When the Canadian dollar rises relative to the U.S. dollar, Canadian producers receive less revenue for their natural gas.
Electricity
- In 2009, Canadian exports of electricity made up over one per cent of U.S. total electricity consumption.[13]
[13] Energy Information Administration (EIA). For further information visit: Total Energy - Electricity.
In 2010:
- Canada exported 43 763 thousand Megawatt hours (MW.h) of electricity - enough to power 2.2 million homes (Figure 7). The average Canadian family uses 12.5 MW.h of electricity per year.[14]
- Canadian gross electricity exports represent nine per cent of production and contribute $2.0 billion in revenue to Canada.
- Canada imported 18 482 thousand MW.h of electricity (Figure 7).
[14] Statistics Canada
Figure 8: 2010 Electricity Supply and Destination (thousand MW.h)
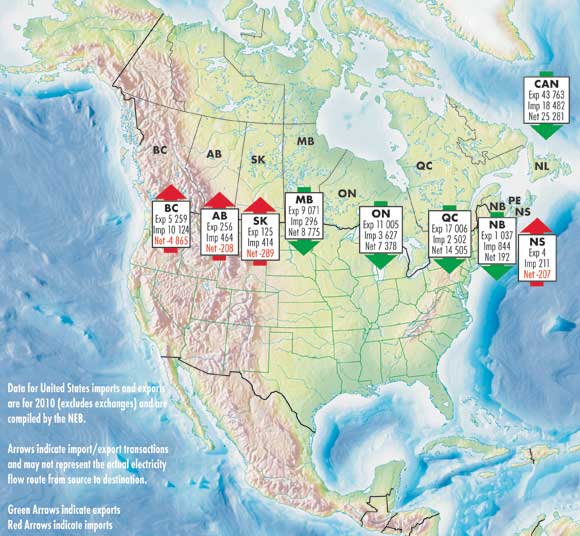
Source: NEB
The NEB's role in Energy Trade
- The NEB regulates approximately 71 000 kilometres of pipelines across Canada that carry crude oil, petroleum products, natural gas and NGLs (such as propane and butane) to Canadian, U.S. and other destinations.[15]
- The NEB regulates approximately 1 400 kilometres of power lines.[16]
- The NEB regulates the export of oil, petroleum products, natural gas, NGLs (such as propane and butane), and electricity; and, the import of natural gas.
- The majority of energy is exported under short-term orders which authorize energy exports and natural gas imports for up to two years. Approximately 99 per cent of Canada's crude oil and natural gas exports are authorized under short-term export orders. In 2010, the Board issued 468 short-term export orders for natural gas, NGLs, crude oil and petroleum products.[17]
- For electricity, most of Canada's exports are under permits for terms of up to 10 years for a blanket permit or up to 30 years for contract-specific exports. In 2010, 14 electricity export permits were issued.
- Exporters are required to provide data on the export volume and price. This data is published on the NEB website. The NEB also conducts independent studies on the supply and demand of energy in Canada; these reports can also be found on the NEB website.
[15] NEB Annual Report 2010 to Parliament
[16] NEB
[17] In 2010, the number of short term orders issued
included: 209 Natural Gas, 70 Propane, 59 Butane, and 130 Crude Oil.
Conclusion
- In 2010, energy exports were valued at $94 billion or 23 per cent of total merchandise trade representing roughly six per cent of Canada's GDP.
- In 2010, Canadian energy imports were valued at $40 billion or roughly ten per cent of total merchandise imports.
- The NEB regulates the pipelines and power lines that transport energy to export markets.
- The NEB regulates the export of crude oil, petroleum products, natural gas, NGLs (such as propane and butane) and electricity; and, the import of natural gas.
- The majority of energy exported is under short-term orders and companies are required to provide data on the prices and volumes of the energy exported to the NEB on a monthly basis.
[18] The NEB does not regulate the transportation or exportation of coal and coal products.
- Date modified: