ARCHIVED - Short-term Canadian Natural Gas Deliverability 2012-2014 - Energy Market Assessment
This page has been archived on the Web
Information identified as archived is provided for reference, research or recordkeeping purposes. It is not subject to the Government of Canada Web Standards and has not been altered or updated since it was archived. Please contact us to request a format other than those available.
Short-term Canadian Natural Gas Deliverability 2012-2014 - Energy Market Assessment [PDF 557 KB]
and Appendices [PDF 1597 KB]
April 2012
Copyright/Permission to Reproduce
ISSN 1910-7773
Table of Contents
List of Figures and Tables
List of Acronyms
List of Units and Conversion Factors
Foreword
Chapter 1: Overview and Summary
Chapter 2: Background
Chapter 3: Key Drivers of Deliverability
Chapter 4: Analysis and Outlook
Chapter 5: Key Differences from Previous Projection
Chapter 6: Recent Issues and Current Trends
Appendices
List of Figures and Tables
| Figure 4.1 | Deliverability Results |
| Figure 4.2 | Natural Gas-Intent Drill Days Comparison |
| Figure 4.3 | Natural Gas-Intent Wells Drilled Comparison |
| Table 4.1 | Pricing Overview and Deliverability Results |
| Table 4.2 | Mid-Range Price Case Summary and Results |
| Table 4.3 | Higher Price Case Summary and Results |
| Table 4.4 | Lower Price Case Summary and Results |
| Table 4.5 | Average Annual Canadian Deliverability and Demand |
List of Acronyms
| CAODC | Canadian Association of Oilwell Drilling Contractors |
| CBM | coalbed methane |
| EIA | Energy Information Administration |
| EMA | Energy Market Assessment |
| HH | Henry Hub (North American Gas Reference Price) |
| LNG | liquefied natural gas |
| NEB | National Energy Board |
| NGLs | natural gas liquids |
| NIT | Nova Inventory Transfer |
| PSAC | Petroleum Services Association of Canada |
| WCSB | Western Canada Sedimentary Basin |
List of Units and Conversion Factors
Units
| m³ | = cubic metres |
| MMcf | = million cubic feet |
| Bcf | = billion cubic feet |
| m³/d | = cubic metres per day |
| 106m³/d | = million cubic metres per day |
| MMcf/d | = million cubic feet per day |
| Bcf/d | = billion cubic feet per day |
| GJ | = gigajoule |
| MMBtu | = million British Thermal Units |
Common Natural Gas Conversion Factors
1 million m³ (@ 101.325 kPaa and 15°C) = 35.3 MMcf (@ 14.73 psia and 60°F)
1 GJ (Gigajoule) = .95 Mcf (thousand cubic feet) = .95 MMBtu = .95 decatherms
Price Notation
North American natural gas prices are quoted at Henry Hub and given in $US/MMBtu.
Canadian natural gas prices are quoted as the Alberta Gas Reference Price and are listed in $C/GJ.
Foreword
The National Energy Board (the NEB or the Board) is an independent federal regulator whose purpose is to promote safety and security, environmental protection and efficient infrastructure and markets in the Canadian public interest[1] within the mandate set by Parliament for the regulation of pipelines, energy development, and trade.
[1] The public interest is inclusive of all Canadians and refers to a balance of economic, environmental, and social considerations that change as society's values and preferences evolve over time.
The Board's main responsibilities include regulating the construction and operation of interprovincial and international oil and gas pipelines, international power lines, and designated interprovincial power lines. Furthermore, the Board regulates the tolls and tariffs for the pipelines under its jurisdiction. With respect to the specific energy commodities, the Board regulates the export of natural gas, oil, natural gas liquids (NGLs) and electricity, and the import of natural gas. Additionally, the Board regulates oil and gas exploration and development on frontier lands and offshore areas not covered by provincial or federal management agreements.
The Board also monitors energy markets, and provides its view of the reasonable foreseeable requirements for energy use in Canada having regard to trends in the discovery of oil and natural gas[2]. The Board periodically publishes assessments of Canadian energy supply, demand and markets in support of its ongoing market monitoring. These assessments address various aspects of energy markets in Canada. This Energy Market Assessment (EMA), Short-term Canadian Natural Gas Deliverability, 2012–2014, is one such assessment. It examines the factors that affect natural gas supply in Canada in the short term and presents an outlook for deliverability through 2014.
[2] This activity is undertaken pursuant to the Board's responsibilities under Part VI of the National Energy Board Act and the Board's decision in GHR-1-87.
While preparing this report, in addition to conducting its own quantitative analysis, the NEB held a series of informal meetings and discussions with natural gas producers, pipeline companies, and industry associations. The NEB appreciates the information and comments provided and would like to thank all participants for their time and expertise.
If a party wishes to rely on material from this report in any regulatory proceeding before the NEB, it may submit the material, just as it may submit any public document. Under these circumstances, the submitting party in effect adopts the material and that party could be required to answer questions pertaining to the material.
This report does not provide an indication about whether any application will be approved or not. The Board will decide on specific applications based on the material in evidence before it at that time.
Chapter 1: Overview and Summary
This report provides an outlook for Canadian natural gas deliverability[3]from the beginning of 2012 to the end of 2014.
[3] Deliverability is the estimated amount of gas supply from a given area based on historical production and individual well declines, as well as projected activity. Gas production may be less than deliverability due to a number of factors, such as weather related supply interruptions, and shut-in production due to economic or strategic considerations.
Major factors influencing deliverability over this period include:
- Canadian natural gas prices generally increased from 2003 to 2008, averaging almost $7.00/GJ. Prices have since declined and the Nova Inventory Transfer (NIT) price averaged $3.28/GJ in 2011. The decline in prices is due to oversupply conditions caused by rising U.S. shale gas production during a time of slowing demand growth. Recent oil prices are much greater than the price of natural gas on an energy equivalency basis. The price differential between oil and gas continues to draw investment to oil and away from natural gas.
- The divergence between natural gas and oil prices is altering the economics of natural gas produced in the presence of noticeable amounts of natural gas liquids (NGLs) compared to those without (dry natural gas).[4]
- Dry natural gas targeted drilling is not economic at current natural gas prices. At current prices, the revenues earned by natural gas sales over a well’s producing life are not likely to cover the costs to find, develop, and produce the gas including a reasonable return on the investment.
- Liquids-rich or wet natural gas targeted drilling can be economic at current natural gas and oil prices. Extraction and sale of NGLs from the gas stream supplements the revenue earned from producing natural gas. Depending on the amount of NGLs in the natural gas, the additional revenue earned from the sale of the NGLs can be more than the revenue earned from the natural gas itself. NGL prices tend to more closely follow the price of oil.
[4] NGLs are liquid hydrocarbons including propane, butanes, and pentanes plus. Natural gas containing commercial amounts of NGLs is known as NGL-rich, liquids-rich or wet gas. Dry natural gas contains little or no NGLs. Gas produced from oil wells includes gas in solution within the oil (solution gas) and gas adjacent to the oil within the reservoir (associated gas). Production of solution gas and associated gas is almost entirely dictated by oil operations, and is typically not influenced by natural gas market conditions.
These important factors have diverted investment and drilling activity away from targeting dry natural gas in Canada and the U.S., and will likely cause Canadian deliverability to decline over the projection period. Total Canadian natural gas deliverability will continue to be well above the level of Canadian demand.
Recognizing the uncertainty associated with future natural gas prices, this report examines three price cases for Canadian natural gas deliverability.
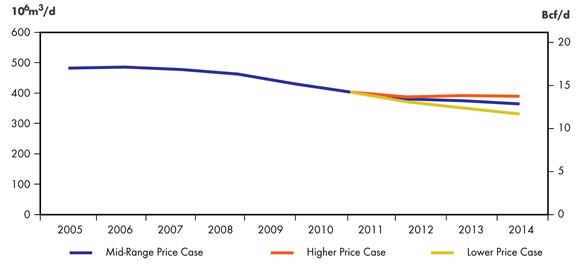
- A Lower Price Case based upon persistent oversupply conditions where natural gas prices remain below 2011 levels throughout the projection period. Prices reach $3.00/MMBtu in 2014. New natural gas drilling predominantly targets liquids-rich natural gas. Deliverability declines steadily from 400 106m³/d (14.1 Bcf/d) in 2012 to 341 106m³/d (12.0 Bcf/d) in 2014.
- A Higher Price Case where current oversupply conditions end by 2014, causing natural gas prices to reach $6.00/MMBtu. At this point, drilling for dry gas in Western Canada becomes economic. A return to dry gas drilling in 2014 would only begin to impact deliverability later in the projection period. As a result, deliverability would continue to decline, but to a lesser extent reaching 403 106m³/d (14.2 Bcf/d) in 2013 and 385 106m³/d (13.6 Bcf/d) in 2014.
- A Mid-Range Price Case resulting from a reduction in oversupply conditions that leads to a $4.50/MMBtu natural gas price by 2014. Prices support drilling for NGL-rich gas and minor levels of dry gas drilling. Deliverability trends downward to 373 106m³/d (13.2 Bcf/d) by 2014.
The Analysis and Outlook section of this report contains the key assumptions for each price case.
The Appendices contains a detailed description of the methodology used in projecting deliverability.
Chapter 2: Background
The Canadian and U.S. natural gas supply has been affected by recent growth in natural gas production. Highlighted below are key factors that have shaped expectations regarding future deliverability.
General
- Canadian and U.S. natural gas prices have declined and are near their lowest levels in almost a decade due to growing U.S. deliverability and a slowing of demand growth. In contrast, oil prices have increased and are nearing their highest average annual level in over a decade.
- Total Canadian and U.S. marketable (sales) natural gas[5]production has increased since 2005 and is currently at approximately 2153 106m³/d (76 Bcf/d). The growth of natural gas production can mostly be attributed to an increase in shale gas activity in the U.S.
[5] Marketable (sales) gas is gas that has been processed to remove impurities and NGLs, and meets specifications for use as an industrial, commercial, or domestic fuel.
Canada
- Western Canada is the major source of domestic natural gas production and currently accounts for approximately 98 per cent of total Canadian marketable production. Nova Scotia and New Brunswick[6]provide most of the remaining natural gas production with minor amounts coming from Ontario, Northwest Territories, and Yukon.
- In 2011, Canada produced approximately 414 106m³/d (14.6 Bcf/d) of natural gas - a slight increase over 2010. Canadian natural gas production had previously declined from 482 106m³/d (17.0 Bcf/d) in 2005 to 431 106m³/d (15.2 Bcf/d) by late 2009.
- Until 2006, natural gas had consistently been the target of 70 to 80 per cent of the oil and gas wells drilled in Canada. Since 2006, gas targeted drilling has declined steadily, and in 2011 accounted for only 37 per cent of drilling.
- Canada’s deliverability continues to exceed its own demand needs and the remaining production is exported to the U.S.
[6] The Canaport terminal in New Brunswick is the only operating liquefied natural gas (LNG) import terminal in Canada. Since gas supply for LNG projects comes from outside the country, LNG imports are not included in this report on Canadian gas deliverability.
U.S.
- U.S. natural gas production occurs in many of the lower-48 states and offshore in the Gulf of Mexico. Alaskan production does not have access to markets in Canada or the lower-48 states.
- The U.S. averaged 1720 106m³/d (60.7 Bcf/d) of natural gas production in 2011. The increase in shale gas production from the Gulf Coast, Mid-Continent, and Northeast regions currently exceeds the growth in natural gas demand in all of Canada and U.S., contributing to the oversupply situation in North America. The increasing U.S. deliverability is accommodating more of that country’s requirements and reducing the need for imports from Canada.
- Natural gas targeted drilling in the U.S. has followed the same decreasing trend as in Canada as activity has shifted to oil, and currently sits at approximately 45 per cent of the total oil and gas wells drilled in a year.
Chapter 3: Key Drivers of Deliverability
Key supply and demand drivers influencing future Canadian natural gas deliverability include:
- Natural gas producers in Canada responding to the decline in prices by shifting drilling activity away from dry natural gas to liquids-rich natural gas and crude oil projects.
- Producers will continue to target natural gas deposits that are richer in liquid hydrocarbons (propane, butanes, and pentanes plus) since those liquids provide an additional source of revenue. However, liquids-rich/wet natural gas wells often produce less gas than dry natural gas wells.
- Horizontal drilling and multi-stage hydraulic fracturing[7]techniques originally employed in shale gas developments have migrated into crude oil recovery. Many formations previously considered too impermeable to produce economic quantities of oil are now the target of drilling. These new oil targets are attracting significant upstream investment.
- The additional crude oil and bitumen drilling will increase utilization of labour, materials, and equipment and could contribute to cost inflation in the drilling and service industries. Cost inflation will be felt in service industry activity and add to the competitive environment for producers targeting natural gas or oil.
- Canadian producers are continuing to drill a greater percentage of gas wells that target deeper formations in British Columbia and western Alberta. Deeper formations often produce at higher rates, but are more costly to develop.
- Additional higher capacity drilling rigs are being constructed to drill into medium and deep formations with long horizontal legs. Rigs that target shallow formations will remain heavily under-utilized.
- The growing use of high-horsepower drilling rigs is increasing the efficiency of deeper drilling operations.
- The decline in gas prices has made it difficult to raise investment capital for shallow gas drilling and has significantly reduced shallow gas activity in Saskatchewan and southeastern Alberta.
- Production can occur from multiple formations simultaneously, thereby increasing the potential productivity of new wells.
- Levels of natural gas drilling in Canada over the 2012 to 2014 period will likely not be adequate to offset ongoing declines in output from existing producing wells. Even though new wells are producing natural gas at higher initial rates, overall deliverability is likely to decrease.
- The combination of lower natural gas prices and higher oil prices has led to a pullback in natural gas drilling in B.C.’s Horn River Basin. Even though individual wells from the Horn River Basin produce gas in large quantities, the natural gas is dry.
- Most producers that restrained their Horn River Basin drilling operations in 2011 appear to be keeping drilling activity at a lower level until market conditions improve.
- Horn River Basin producers that have agreements with joint venture partners to contribute capital towards drilling and completion costs may maintain or increase activity over the 2012 to 2014 period.
- Declining natural gas production prior to 2010 and increased gas consumption in the oil sands have reduced the utilization of pipelines leaving Western Canada. As utilization drops, unit transportation costs tend to rise. This affects the competitiveness of Western Canadian gas in markets in Central Canada, as well as markets in the U.S.
- LNG net imports into Canada and the U.S. stabilized at approximately 31.2 106m³/d (1.1 Bcf/d) through most of 2011. This level represents approximately six per cent of Canada and U.S. import capacity. LNG imports are unlikely to increase as long as oversupply conditions in Canada and the U.S. keep prices below European and Asia-Pacific markets.
- LNG exports from Canada have the potential to begin in the next few years. The minor volume of natural gas proposed for export in 2015 is not likely to influence Canadian natural gas prices.
- A moderating factor on any potential increase in Canadian and U.S. natural gas prices is the prospect of additional U.S. natural gas supplies entering the market. These include an inventory of highly productive U.S. shale gas wells that are not yet completed or connected into the pipeline system. While producers may postpone the production of newly drilled wells in the current price environment, eventually these wells will add to overall natural gas production. It is possible that the oversupply of natural gas in North America could extend through 2014.
- Participants in natural gas markets are able to reduce the risk of price volatility by locking in the price of a future delivery of natural gas. Since prices began declining in 2009, this form of contracting a future natural gas price, or “hedging”, has allowed producers to capture prices higher than the current spot price. Through this practice, the gas sales revenues to hedged producers may reflect a higher average price for the year than indicated by the standard market indexes (Henry Hub in the U.S., NIT in Western Canada). Producers were able to base their natural gas drilling activities on the higher price that they achieved through hedging. As producers look out to 2013 and beyond, futures prices have tended to be lower than the cost to supply the gas, and this means a hedge would be equivalent to locking in a guaranteed loss on a future sale. Understandably, producers have been pulling back from applying new hedges in the current pricing environment. Indications are that much less natural gas has been or will be hedged in 2013 and 2014 and that market index prices will be more reflective of actual sales prices for those years.
- Natural gas-fired power generation is competing with some of the older and less-efficient coal-fired units in some markets. This occurs when natural gas prices decline to levels where gas generation is cost-competitive with coal. This increases gas demand and could gradually reduce the oversupply situation.
- Expanding oil sands production is also increasing natural gas demand in Western Canada.
[7] Fracturing is a technique in which fluids are injected underground, in multiple stages, to create or expand existing fractures in the rock, allowing oil or gas to flow out of the formation, or to flow at a faster rate.
Chapter 4: Analysis and Outlook
A decline in natural gas drilling activity is expected over the projection period in the Mid-Range and Lower Price Cases. The Higher Price Case will see a decline in drilling activity before increasing in 2014. As natural gas drilling activity slows while Canadian and U.S. demand increases, natural gas prices may begin to trend upward, eventually providing the incentive for additional natural gas drilling. The timing and degree of this transition from declining to increasing natural gas activity is uncertain. To help address the uncertainty, this report examines three price cases for Canadian natural gas deliverability. These cases differ primarily in terms of Canadian and U.S. natural gas prices and the corresponding levels of capital investment. The cases also vary in terms of drilling levels targeting wet gas and dry gas, particularly in the Montney play of Alberta and B.C., and Horn River Shale prospects in northeastern B.C. The Appendices contain a detailed description of the methodology used for projecting deliverability. The cases are:
- A Lower Price Case based upon persistent oversupply conditions where natural gas prices remain below 2011 levels throughout the projection period. Prices reach $3.00/MMBtu in 2014. New natural gas drilling predominantly targets liquids-rich natural. Deliverability declines steadily from 400 106m³/d (14.1 Bcf/d) in 2012 to 341 106m³/d (12.0 Bcf/d) in 2014.
- A Higher Price Case where current oversupply conditions end by 2014, causing natural gas prices to reach $6.00/MMBtu. At this point, drilling for dry gas in Western Canada becomes economic. A return to dry gas drilling in 2014 would only begin to impact deliverability later in the projection period. As a result, deliverability would continue to decline, but to a lesser extent reaching 403 106m³/d (14.2 Bcf/d) in 2013 and 385 106m³/d (13.6 Bcf/d) in 2014.
- A Mid-Range Price Case resulting from a reduction in oversupply conditions that leads to a $4.50/MMBtu natural gas price by 2014. Prices support drilling for NGL-rich gas and minor levels of dry gas drilling. Deliverability trends downward to 373 106m³/d (13.2 Bcf/d) by 2014.
A summary of the key assumptions used in the cases and the deliverability results is shown in Table 4.1:
Table 4.1 -Pricing Overview and Deliverability Results
| Mid-Range Price Case | Higher Price Case | Lower Price Case | ||||||||
|---|---|---|---|---|---|---|---|---|---|---|
| 2011 | 2012 | 2013 | 2014 | 2012 | 2013 | 2014 | 2012 | 2013 | 2014 | |
| Henry Hub (HH) Average Price (US$/MMBtu) | $4.00[1] | $3.75 | $4.25 | $4.50 | $4.75 | $5.25 | $6.00 | $2.50 | $2.75 | $3.00 |
| Alberta Gas Reference Price (C$/GJ) | $3.28[2] | $3.11 | $3.51 | $3.69 | $4.12 | $4.53 | $5.22 | $1.86 | $1.98 | $2.15 |
| Natural Gas Drilling Expenditures ($ Millions) | 6362 | 6159 | 5455 | 6967 | 6530 | 7276 | 3622 | 3160 | 2838 | |
| Natural Gas-Intent Drill Days | 32714 | 30482 | 26470 | 34889 | 31187 | 33655 | 19120 | 16030 | 14108 | |
| Natural Gas-Intent Wells Drilled | 2782[3] | 2159 | 1755 | 1384 | 2297 | 1761 | 2118 | 887 | 637 | 533 |
| Gas Share of Drill Days (per cent) | 37 | 30 | 25 | 20 | 32 | 30 | 33 | 25 | 23 | 18 |
| Size of WCSB Rig Fleet | 795[4] | 803 | 799 | 796 | 812 | 808 | 804 | 789 | 785 | 782 |
| Canadian Deliverability (106m³/d) | 414[5] | 410 | 397 | 373 | 413 | 403 | 385 | 400 | 372 | 341 |
| Canadian Deliverability (Bcf/d) | 14.6 | 14.5 | 14.0 | 13.2 | 14.6 | 14.2 | 13.6 | 14.1 | 13.1 | 12.0 |
[1] EMA - Short Term Energy Outlook, 10 Jan. 2012.
[2] Government of Alberta, Alberta Gas Reference Price History - January-December 2011.
[3] PSAC Estimate - 26 January 2012
[4] CAODC Estimate – 27 October 2012
[5] Annual average of NEB reported provincial production, where available.
For this analysis, the Board divides natural gas production in Western Canada into conventional, coalbed methane (CBM), and shale gas categories. Within the conventional gas category, there is a sub-category called tight gas. Due to large regional differences in physical and producing characteristics, the Board further subdivides these categories into smaller geographic areas, or regions, which have similar characteristics for production decline analysis. Within each region, grouping of the producing formations takes place on a geological basis. Details on the characterization of the resources are available in Appendix B. Canadian natural gas production outside of Western Canada includes:
- Onshore production from New Brunswick, Ontario, Yukon, and Northwest Territories, which will continue to decline as minimal future drilling activity is expected over the projection period.
- The latest indication from the operator for the Deep Panuke offshore project in Nova Scotia calls for the project to begin producing natural gas in July 2012. The Deep Panuke volumes will help to offset ongoing declines in output from the Sable Island fields.
- Shale gas potential exists in Quebec; however, insufficient data is available. Consequently, this report does not show any natural gas deliverability throughout the projection period.
Deliverability Outlooks
The three price cases cover a range from a Lower Price Case where almost all drilling of natural gas is uneconomic unless the gas has a high NGL content, to a Higher Price Case where natural gas supply and demand move into balance and provide an incentive for the resumption of dry natural gas drilling. A Mid-Range Price Case is largely reliant on activity targeting NGL-rich gas as prices do not reach levels that would support much drilling for dry natural gas. A comparison of the three Canadian natural gas deliverability outlooks to 2014 under these alternative market conditions is shown in Figure 4.1.
Figure 4.1 - Deliverability Results
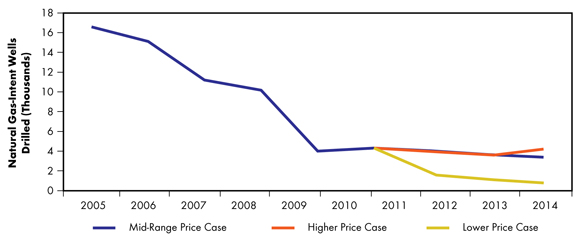
The levels of drilling activity that provide these deliverability outcomes are the result of capital investment assumptions and estimates of drilling costs. A comparison of natural gas drilling activity in the three cases in terms of drill days and gas-intent wells drilled are shown in Figure 4.2 and Figure 4.3, respectively.
Figure 4.2 - Natural Gas-Intent Drill Days Comparison
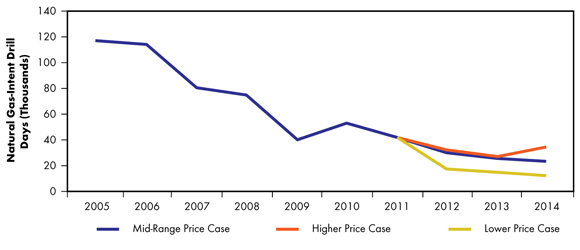
Figure 4.3 - Natural Gas-Intent Wells Drilled Comparison
Mid-Range Case
For the Mid-Range Price Case, oversupply conditions continue to drive 2012 Canadian and U.S. natural gas prices below those experienced in 2011. After 2012, prices gradually rise, but not enough for much dry gas drilling to become economic. Producers would continue to reduce natural gas drilling, particularly for dry natural gas. With a decrease in overall natural gas drilling, Canadian production declines, and U.S. production growth slows. The demand for natural gas slowly increases, and as the amount of oversupply is reduced, natural gas prices begin to rise gradually. Increased oil targeted drilling will contribute additional gas to overall supply as oil production also brings on associated and solution gas, but total gas deliverability will still be less than in 2011. Liquids-rich natural gas drilling will take place in locations where NGL contents are high enough to make production economic.
Deliverability Results
In the Mid-Range Price Case, Canadian natural gas deliverability will continue to be well above Canadian demand. The rate of decline in overall deliverability slows slightly due to higher productivity wells coming on-stream. Tight gas and shale gas activity stabilizes in 2012 with 229 wells drilled in the Montney and 39 in Horn River. Horn River deliverability decreases from 16 106m³/d (555 MMcf/d) in 2012 to 15 106m³/d (522 MMcf/d) in 2014. Montney deliverability increases from 46 106m³/d (1.62 Bcf/d) in 2012 to 55 106m³/d (1.95 Bcf/d) in 2014.
Implications
Slowing gas drilling activity and rising natural gas demand would begin to reduce the oversupply conditions. Reduced drilling for dry natural gas is expected to occur in Canada and the U.S. Growth in Canadian natural gas demand would consume a greater proportion of the country’s available deliverability, thereby reducing the net volumes available for export. Prices rise by U.S. $0.50 per MMBtu between 2011 and 2014.
Table 4.2 - Mid-Range Price Case Summary and Results
| Average HH Price $US/MMBtu |
Gas Intent Drill Days | Gas Intent Wells | Average Deliverability | ||
|---|---|---|---|---|---|
| 106m³/d | Bcf/d | ||||
| 2011 | $4.00[1] | 2782[2] | 414[3] | 14.6 | |
| 2012 | $3.75 | 32714 | 2159 | 410 | 14.5 |
| 2013 | $4.25 | 30482 | 1755 | 397 | 14.0 |
| 2014 | $4.50 | 26470 | 1384 | 373 | 13.2 |
[1] EMA - Short Term Energy Outlook, 10 Jan. 2012.
[2] PSAC Estimate - 26 January 2012
[3] Annual average of NEB reported provincial production, where available.
Full results of this scenario are available in Appendix C.
Higher Price Case
The Higher Price Case would see a closer balance between supply and demand before the end of the projection period. As natural gas prices rise, a movement back towards dry natural gas targeted drilling takes place, starting with liquids-rich gas in 2012 and 2013 followed by growth in dry natural gas targeted drilling in 2014. As natural gas prices rise, there may be less substitution of coal-fired electricity generation by natural gas.
Deliverability Results
Canadian natural gas deliverability declines more slowly than in the Mid-Range Price Case due to additional natural gas-intent drilling. Deliverability decreases from 414 106m³/d (14.6 Bcf/d) in 2011 to 385 106m³/d (13.6 Bcf/d) by 2014. Liquids-rich natural gas is still the primary source of new production, along with growing volumes of associated and solution gas. Even with a greater increase in price when compared to the Mid-Range Price Case, dry natural gas drilling will not be significant until 2014 when prices reach U.S. $6.00/MMBtu and shallower, less complex dry gas developments begins to attract some capital. Horn River deliverability increases from 17 106m³/d (597 MMcf/d) in 2012 to 18 106m³/d (617 MMcf/d) in 2014. Montney deliverability increases from 47 106m³/d (1.67 Bcf/d) in 2012 to 61 106m³/d (2.16 Bcf/d) in 2014.
Implications
In the Higher Price Case, the return of dry gas activity during a period of high oil activity would put additional pressure on the drilling and pressure pumping services in particular. Cost escalation could accelerate if shortages of labour, equipment, or materials were to become severe. When combined with ongoing increases in solution gas, associated gas, and NGL-rich gas production, additional natural gas drilling will slow the decline in overall deliverability. Overall growth in deliverability will not take place over the projection period, even though natural gas prices rise each year.
Table 4.3 - Higher Price Case Summary and Results
| Average HH Price $US/MMBtu |
Gas Intent Drill Days | Gas Intent Wells | Average Deliverability | ||
|---|---|---|---|---|---|
| 106m³/d | Bcf/d | ||||
| 2011 | $4.00[1] | 2782[2] | 414[3] | 14.6 | |
| 2012 | $4.75 | 34889 | 2297 | 413 | 14.6 |
| 2013 | $5.25 | 31187 | 1761 | 403 | 14.2 |
| 2014 | $6.00 | 33655 | 2118 | 385 | 13.6 |
[1] EMA - Short Term Energy Outlook, 10 Jan. 2012.
[2] PSAC Estimate - 26 January 2012
[3] Annual average of NEB reported provincial production, where available.
Full results of this case are available in Appendix C.
Lower Price Case
The Lower Price Case assumes a continuation of oversupply conditions due to significant contributions from solution gas, associated gas, and more U.S. NGL-rich gas. The Lower Price Case sees substantially less natural gas drilling activity than in the Mid-Range Price Case since most drilling in the Lower Price Case is supported solely by oil and NGL prices. Lower natural gas prices would impact drilling in areas with lesser NGL content as they would slip below the economic cut-off. The minimal dry gas drilling in the Mid-Range Price Case would be further discouraged.
Deliverability Results
Canadian natural gas deliverability declines steadily to 341 106m³/d (12.0 Bcf/d) in 2014, a decrease of 73 106m³/d (2.6 Bcf/d) from 2011, but is still well above Canadian demand. Lower natural gas prices would further reduce the attractiveness of investment in the sector.
Implications
Canadian natural gas consumers would benefit from lower natural gas prices. However, this case also shows the greatest decline in natural gas deliverability. Oil-related activity might be able to compensate for reduced natural gas operations to maintain Canadian drilling and service activity. The potential transition toward oil and away from natural gas would tend to shift some capital investment away from gas-prone B.C. and into oil-prone Saskatchewan, while the impact would be mixed in Alberta.
Table 4.4 - Lower Price Case Summary and Results
| Average HH Price $US/MMBtu |
Gas Intent Drill Days | Gas Intent Wells | Average Deliverability | ||
|---|---|---|---|---|---|
| 106m³/d | Bcf/d | ||||
| 2011 | $4.00[1] | 2782[2] | 414[3] | 14.6 | |
| 2012 | $2.50 | 19120 | 887 | 400 | 14.1 |
| 2013 | $2.75 | 16030 | 637 | 372 | 13.1 |
| 2014 | $3.00 | 14108 | 533 | 341 | 12.0 |
[1] EMA - Short Term Energy Outlook, 10 Jan. 2012.
[2] PSAC Estimate - 26 January 2012
[3] Annual average of NEB reported provincial production, where available.
Full results of this case are available in Appendix C.
Canadian Deliverability and Demand
The Board’s outlooks for gas deliverability and Canadian gas demand over the projection period are included in Table 4.5. The Board projects annual Canadian natural gas demand to grow by 17 106m³/d (0.6 Bcf/d) between 2012 and 2014. Most of this increase in natural gas demand would be from increased usage for oil sands development in Alberta. Natural gas deliverability, even in the Lower Price Case, will exceed expected Canadian demand.
Table 4.5 - Average Annual Canadian Deliverability and Demand
| 2011 | 2012 | 2013 | 2014 | |||||
|---|---|---|---|---|---|---|---|---|
| 106m³/d | Bcf/d | 106m³/d | Bcf/d | 106m³/d | Bcf/d | 106m³/d | Bcf/d | |
| Canadian Deliverability, Mid-Price Case | 414.0 | 14.6 | 409.9 | 14.5 | 396.8 | 14.0 | 372.8 | 13.2 |
| Total Canadian Demand | 252.1 | 8.9 | 260.6 | 9.2 | 266.3 | 9.4 | 277.6 | 9.8 |
| Western Canada Demand | 147.3 | 5.2 | 153.0 | 5.4 | 155.8 | 5.5 | 164.3 | 5.8 |
| Eastern Canada Demand | 104.8 | 3.7 | 107.6 | 3.8 | 110.5 | 3.9 | 113.3 | 4.0 |
Chapter 5: Key Differences from Previous Projection
Comparing the actual performance in deliverability with the Board’s most recent assessment, Short-term Canadian Natural Gas Deliverability 2011-2013, Canadian natural gas prices in 2011 tracked very close to the Board’s Mid-Range Price Case, however, deliverability was higher than forecast and was above the Board’s High Price Case.[8] This likely occurred for a few key reasons:
[8] National Energy Board. Short-term Canadian Natural Gas Deliverability 2011-2013
- A greater impact from price hedging than expected. Many producers were able to hedge their production at prices that were higher than market prices and this fostered additional gas targeted activity.
- Initial production rates in 2011 were higher than anticipated for some key groupings. For instance, new Horn River Basin shale wells and Montney tight gas wells produced at higher rates than expected. Higher initial production rates were due to selection of only the best prospects (“high-grading”). Advances in technology that included drilling longer horizontal well sections with a corresponding increase in the number of hydraulic fracture stages per well, also contributed to higher production rates.
- Efficiency improvements such as drilling multiple wells from a single pad reduced costs by allowing wells to be drilled more quickly.
Chapter 6: Recent Issues and Current Trends
Listed below are developments that will affect future North American natural gas deliverability.
- After three years of natural gas production declines, Canadian natural gas production stabilized in 2011 despite a modest decline in drilling activity from 2010. The key reason was a transition to higher productivity wells in shales and deeper horizons in B.C. and in western Alberta.
- The rise in oil-related activity is likely to cause cost inflation in an active Western Canadian drilling and service industry, which will affect both gas and oil producers. Higher rates for oil and gas services will affect levels of future drilling.
- Some large international companies with existing Canadian operations have focused their activity on liquids-rich shale assets in the U.S. at the expense of Canadian activities. Many of Canada’s gas producers also have international operations with diverse portfolios. Canadian prospects have to compete with international prospects for investment capital.
- Activity could slow in British Columbia’s Horn River Basin as companies producing the dry gas do not benefit from NGL revenues.
- Other Canadian shale gas plays such as the Cordova Embayment in northeastern B.C., and the Duvernay in Alberta, are at an early stage of development and modest levels of drilling are expected to evaluate the resources and determine the most effective drilling and completion techniques.
- U.S. horizontal drilling for shale gas has increased since 2008 despite a significant decline in prices. In recent years, this may have been largely due to the need to drill and produce gas to retain leases. With land from the peak leasing years now largely held by production, the need to drill dry gas wells for this purpose is expected to drop over the 2012 to 2014 period.
- The objective of widespread use of best practices in hydraulic fracturing, integrity of well casing, water use, and disposal, may include additional monitoring and regulations that could affect activity and increase costs.
- Increases in Canadian and U.S. natural gas demand may gradually offset the rise in U.S. shale gas production and accelerate a return to a more balanced market. The level of natural gas demand is dependent on a number of both independent and interrelated factors, such as the pace of economic growth, electricity demand, and the pace of oil sands development.
- Canadian and U.S. weather patterns have a large influence on natural gas demand for space heating and cooling. Temperatures in the 2010-2011 winter were far below normal, which contributed to a large increase in heating requirements and gas demand. The summer months in 2011 were very warm and increased gas demand for electricity generation to run air conditioners. Conversely, winter temperatures in 2011-2012 were well above normal and reduced gas demand. Due to the unpredictability of weather, an assumption of normal weather conditions is used in this analysis.
Appendices
Appendix A
A1 Methodology (Detailed Description)
A2 Deliverability Parameters - Results
A3 Decline Parameters for Groupings of Existing Gas Connections
A4 Decline Parameters for Groupings of Future Gas Connections
Appendix B
B1 Factors for Allocation of Gas-Intent Drill Days to Resource Groupings
B2 Detailed Gas-Intent Drilling and Gas Connection Projections by Case
Appendix C
Deliverability Details by Case
Appendix D
Total Canadian Deliverability Comparison of Cases
Appendix E
Average Annual Canadian Deliverability and Demand
- Date modified: