ARCHIVED – Canada’s Renewable Power Landscape 2017 – Energy Market Analysis
This page has been archived on the Web
Information identified as archived is provided for reference, research or recordkeeping purposes. It is not subject to the Government of Canada Web Standards and has not been altered or updated since it was archived. Please contact us to request a format other than those available.

Quebec
Quebec generated 99.8% of its electricity from renewable sources in 2016, and had the highest percentage of renewable generation in Canada. Hydro was the primary source of Quebec’s electricity, accounting for 95.2% of generation. Wind and biomass were Quebec’s next largest electricity sources.
FIGURE 17 Electricity Generation by Source in Quebec
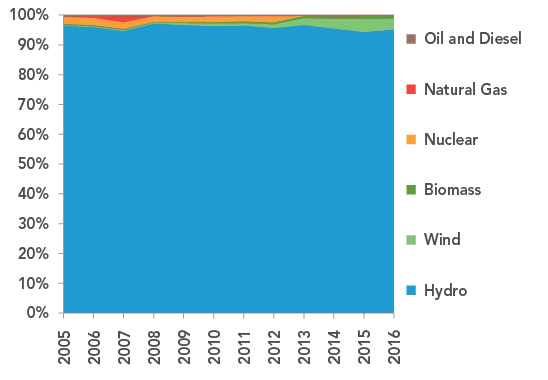
Description
This graph shows the composition of Quebec’s electricity generation between 2005 and 2016. On average, hydro accounted for 95.9% of generation. Wind increased from 0.2% in 2005 to 3.6% in 2016. Biomass increased from 0.4% to 1.0%. Nuclear power dropped from 2.4% to zero in 2012. Natural gas, oil and diesel accounted for about 0.2% in 2016.
TABLE 7 Electric Capacity and Generation in Quebec
| Capacity in MW and % | Generation in GW.h and % | |||||
|---|---|---|---|---|---|---|
| 2005 | 2015 | 2016 | 2005 | 2015 | 2016 | |
| Oil and Diesel | 1 595 | 589 | 589 | 824 | 518 | 424 |
| 4.1% | 1.3% | 1.3% | 0.5% | 0.3% | 0.2% | |
| Natural Gas | 31 | 591 | 591 | 269 | 100 | 65 |
| 0.1% | 1.3% | 1.3% | 0.1% | <0.1% | <0.1% | |
| Nuclear | 675 | 0 | 0 | 4 322 | 0 | 0 |
| 1.7% | 0.0% | 0.0% | 2.4% | 0.0% | 0.0% | |
| Biomass | 278 | 245 | 275 | 646 | 2 053 | 2 093 |
| 0.7% | 0.5% | 0.6% | 0.4% | 1.0% | 1.0% | |
| Wind | 207 | 3 262 | 3 549 | 416 | 8 938 | 7 360 |
| 0.5% | 7.3% | 7.8% | 0.2% | 4.3% | 3.6% | |
| Hydro | 36 473 | 40 212 | 40 397 | 173 356 | 194 540 | 197 243 |
| 92.9% | 89.6% | 89.0% | 96.4% | 94.4% | 95.2% | |
| All renewable sources | 36 958 | 43 719 | 44 222 | 174 418 | 205 531 | 206 696 |
| 94.1% | 97.4% | 97.4% | 97.0% | 99.7% | 99.8% | |
| All sources | 39 259 | 44 899 | 45 402 | 179 832 | 206 149 | 207 184 |
Generation Trends
Quebec produced 95.2% of its electricity from hydro in 2016, similar to generation shares in 2005. Wind generation increased significantly, from 0.2% in 2005 to 3.6% in 2016. With 7 360 GW.h of wind generation in 2016, Quebec had the second highest wind generation in Canada, after Ontario.
Rural communities in northern Quebec that are not connected to the grid rely on diesel and oil for power generation. This accounted for about 0.2% of generation in 2016. Quebec ceased nuclear generation in 2012 when the Gentilly-2 Nuclear Generating Station was shut down.
Capacity Changes in 2016
Quebec added wind, hydro, and biomass capacity totaling an estimated 502 MW in 2016. The largest wind farms were the Rivière du Moulin and the Mont-Rothery farms.
Hydro-Québec added approximately 185 MW of hydro capacity in 2016 with the completion of Romaine 1. This is the first in a series of hydro facilities constituting the Romaine Complex on the St. Lawrence River.
More Information
Canada’s Renewable Power Landscape 2016 – Energy Market Analysis provides additional information on renewable power in Quebec.
Residential Bills and Greenhouse Gas Generation Intensity
Quebec’s largest city, Montreal, has the lowest residential electricity bill in Canada, at $72 for 1 000 kW.h compared to the Canadian mean of $129 per 1 000 kW.h. Quebec’s GHG generation intensity is also the lowest in Canada, emitting 1.2 grams of GHGs per kW.h compared to the mean of 140 g GHG/kW.h.
FIGURE 18
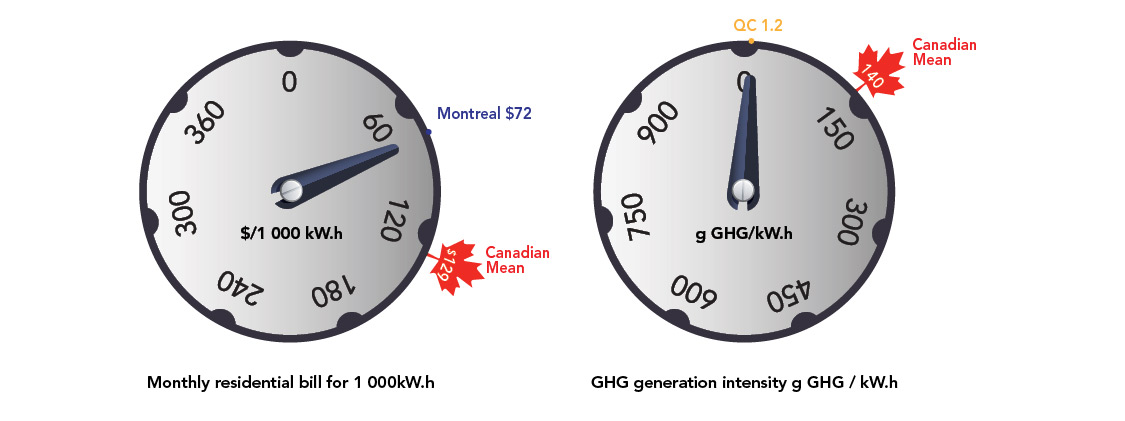
Source and Description
Source:
Hydro-Québec, National Inventory Report
Description:
Two dials indicate the monthly residential electricity bill for 1 000 kW.h and the GHG generation intensity in grams of GHG per kW.h. Quebec’s largest city, Montreal, has the lowest residential electricity bill in Canada, at $72 for 1 000 kW.h compared to the Canadian mean of $129 per 1 000 kW.h. Quebec’s GHG generation intensity is also the lowest in Canada, emitting 1.2 grams of GHGs per kW.h compared to the mean of 140 g GHG/kW.h.
- Date modified: