ARCHIVED – Canada’s Renewable Power Landscape 2017 – Energy Market Analysis
This page has been archived on the Web
Information identified as archived is provided for reference, research or recordkeeping purposes. It is not subject to the Government of Canada Web Standards and has not been altered or updated since it was archived. Please contact us to request a format other than those available.

Nova Scotia
Nova Scotia generated 63.7% of its electricity from coal in 2016. Natural gas was the second largest source of electricity in the province, followed by wind and hydro.
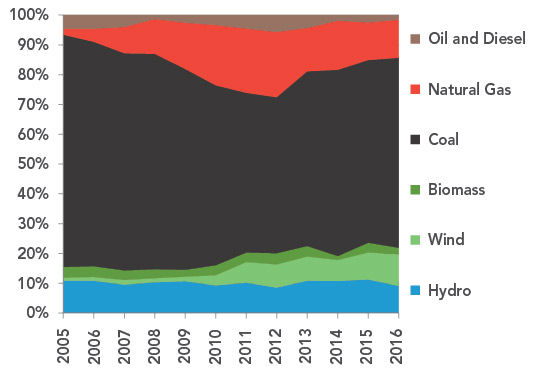
FIGURE 21 Electricity Generation by Source in Nova Scotia
Description
This graph shows the composition of Nova Scotia’s electricity generation between 2005 and 2016. On average, hydro accounted for 10.2% of generation. Wind grew from 1.0% to 10.6%. Biomass generation averaged 3.0%. Coal fell from 77.9% to 63.7%. Natural gas fluctuated from 2.1% in 2005 to a high of 21.9% in 2012 before falling to 12.9% in 2016. Oil and diesel decreased from 4.6% to 1.6%.
TABLE 9 Electric Capacity and Generation in Nova Scotia
| Capacity in MW and % | Generation in GW.h and % | |||||
|---|---|---|---|---|---|---|
| 2005 | 2015 | 2016 | 2005 | 2015 | 2016 | |
| Oil and Diesel | 222 | 222 | 222 | 397 | 226 | 151 |
| 9.3% | 7.7% | 7.4% | 4.6% | 2.5% | 1.6% | |
| Natural Gas | 381 | 482 | 482 | 181 | 1 137 | 1 244 |
| 15.9% | 16.6% | 16.1% | 2.1% | 12.6% | 12.9% | |
| Coal | 1 288 | 1 252 | 1 252 | 6 764 | 5 528 | 6 158 |
| 53.8% | 43.2% | 41.9% | 77.9% | 61.3% | 63.7% | |
| Biomass | 69 | 113 | 128 | 318 | 289 | 212 |
| 2.9% | 3.9% | 4.3% | 3.7% | 3.2% | 2.2% | |
| Wind | 35 | 444 | 515 | 85 | 818 | 1 027 |
| 1.4% | 15.3% | 17.2% | 1.0% | 9.1% | 10.6% | |
| Hydro | 401 | 388 | 388 | 941 | 1 016 | 880 |
| 16.7% | 13.4% | 13.0% | 10.8% | 11.3% | 9.1% | |
| All renewable sources | 505 | 945 | 1 031 | 1 344 | 2 123 | 2 119 |
| 21.1% | 32.6% | 34.5% | 15.5% | 23.6% | 21.9% | |
| All sources | 2 396 | 2 901 | 2 987 | 8 868 | 9 014 | 9 672 |
Generation Trends
Coal generation comprised 63.7% of electricity production in 2016 in Nova Scotia, this is a decrease from 77.9% in 2005. Natural gas’s share increased from 2.1% to 12.9% from 2005 to 2016.
Hydro, wind, and biomass supplied Nova Scotia’s renewable power in 2016. At 10.6%, wind was the largest renewable source, up from 1.0% in 2005. Hydro was the second largest renewable source in Nova Scotia, accounting for 9.1% of total generation in 2016. The Annapolis Tidal Station, on Nova Scotia’s Annapolis River, is the only tidal generation station in Canada. It generates roughly 33 GW.h per year. Biomass averaged 3.0% from 2005 to 2016. Oil and diesel generation averaged 3.4%.
Capacity Changes in 2016
Nova Scotia added new wind and biomass capacity in 2016 totaling an estimated 86 MW.
More Information
Canada’s Renewable Power Landscape 2016 – Energy Market Analysis provides additional information on renewable power in Nova Scotia.
Residential Bills and Greenhouse Gas Generation Intensity
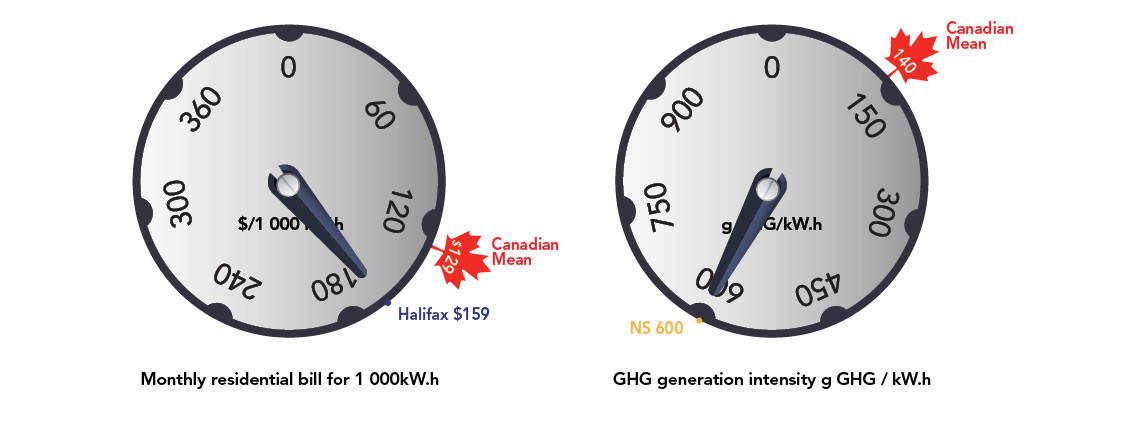
Nova Scotia’s largest city, Halifax, has a residential electricity bill of $159 for 1 000 kW.h somewhat higher than the Canadian mean of $129 per 1 000 kW.h. Nova Scotia’s GHG generation intensity is more than four times higher than most of anada, emitting 600 grams of GHGs per kW.h compared to the Canadian mean of 140 g GHG/kW.h.
FIGURE 22
Source and Description
Source:
Hydro-Québec, National Inventory Report
Description:
Two dials indicate the monthly residential electricity bill for 1 000 kW.h and the GHG generation intensity in grams of GHG per kW.h. Nova Scotia’s largest city, Halifax, has a residential electricity bill of $159 for 1 000 kW.h somewhat higher than the Canadian mean of $129 per 1 000 kW.h. Nova Scotia’s GHG generation intensity is more than four times higher than most of Canada, emitting 600 grams of GHGs per kW.h compared to the Canadian mean of 140 g GHG/kW.h.
- Date modified: