ARCHIVED – Canada’s Renewable Power Landscape 2016 – Energy Market Analysis
This page has been archived on the Web
Information identified as archived is provided for reference, research or recordkeeping purposes. It is not subject to the Government of Canada Web Standards and has not been altered or updated since it was archived. Please contact us to request a format other than those available.
New Brunswick
In New Brunswick, renewables account for 31% of capacity. Hydro, wind and biomass capacity grew by approximately (or 28%) 30% between 2005 and 2015, and renewables’ share of generation increased from 21% to 28%.
The New Brunswick Power Corporation (NB Power), a vertically-integrated Crown corporation, owns about 3 500 MW or 80% of provincial generating capacity. Independent power producers and utilities supply the remaining power, roughly half of which is renewable.
In the last decade, wind registered the strongest growth among renewable sources. There was no wind installed in New Brunswick in 2005. However, after the NB Power issued several RFPs, almost 300 MW of wind was installed between 2008 and 2011. In contrast, hydro and biomass capacity remained relatively unchanged. Nuclear, coal, oil and gas-fired generation account for roughly 70% of the province’s capacity.
New Brunswick plans to meet 40% of provincial electricity demand with renewables by 2020. According to the 2011 New Brunswick Energy Blueprint and 2014 Integrated Resource Plan, this goal will be accomplished through a New Brunswick plans to meet 40% of provincial electricity demand with renewables by 2020. According to the 2011 New Brunswick Energy Blueprint and 2014 Integrated Resource Plan, this goal will be accomplished through a combination of eligible renewable energy imports from other provinces, and by purchased power from local producers and customers through a variety of programs. In 2015, regulations under the Electricity Act were amended to support the 40% renewable portfolio standard.
Under a net metering program, NB Power customers generating electricity for individual use from renewable installations of less than 100 kW can send surplus electricity into the grid. The NB Power Embedded Generation Program allows small-scale renewable energy projects to be connected to the distribution system and sell electricity to the grid.
In January 2016, NB Power issued a call offering to purchase up to 40 MW of electricity from First Nations.
| Capacity in MW and % | Generation in GW.h and % | |||
|---|---|---|---|---|
| 2005 | 2015 | 2005 | 2015 | |
| Hydro | 949 | 957 | 3 875 | 2 728 |
| 22% | 21% | 18% | 19% | |
| Wind | 0 | 294 | 0 | 737 |
| 0% | 7% | 0% | 5% | |
| Biomass | 127 | 127 | 653 | 606 |
| 3% | 3% | 3% | 4% | |
| All renewable sources | 1 076 | 1 378 | 4 528 | 4 070 |
| 25% | 31% | 21% | 28% | |
| All sources | 4 231 | 4 505 | 21 333 | 14 378 |
This table shows New Brunswick's electric capacity and generation from renewables in 2005 and 2015. The share of hydro in total capacity decreased from 22% to 21% while the share of wind increased from 0% to 7% and the share of biomass remained stable at 3%. The share of hydro in total generation increased from 18% to 19% while the share of wind increased from 0% to 5% and the share of biomass increased from 3% to 4%.
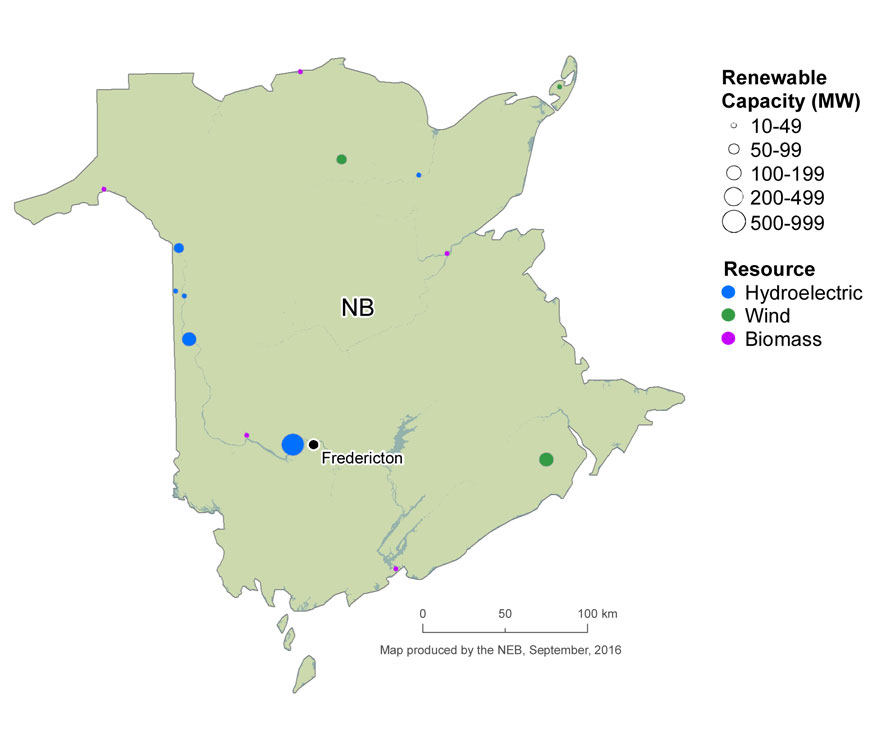
FIGURE 17 Renewable Resources and Capacity in New Brunswick
Text version of this map
This map shows the location and approximate capacity of renewable power plants with a capacity of at least 10 MW across New Brunswick. Renewable power plants are concentrated near the coasts and rivers. Majority of hydroelectric resources are located west, while wind resources are located east and biomass resources are scattered throughout the province. There are no solar resources with a capacity of at least 10 MW.
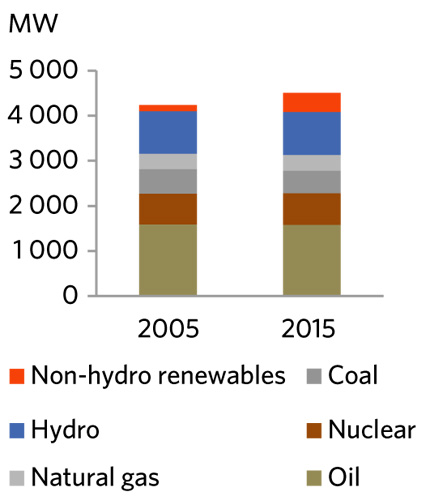
FIGURE 18 Electric Generation Capacity in New Brunswick
Text version of this graphic
This bar graph shows New Brunswick’s total electric capacity in 2005 and 2015 for all fuel sources. Capacity increased from 4 231 MW to 4 505 MW, with renewables increasing from 25% to 31% of total capacity.
- Date modified: