ARCHIVED – Tight Oil Developments in the Western Canada Sedimentary Basin - Energy Briefing Note
This page has been archived on the Web
Information identified as archived is provided for reference, research or recordkeeping purposes. It is not subject to the Government of Canada Web Standards and has not been altered or updated since it was archived. Please contact us to request a format other than those available.
ISSN 1917-506X
Tight Oil Developments in the Western Canada Sedimentary Basin - Energy Briefing Note [PDF 2505 KB]
Energy Briefing Note
Tight Oil Developments in the Western Canada Sedimentary Basin
December 2011
Copyright/Permission to Reproduce
Table of Contents
- Foreword
- Introduction
- History of WCSB Light Oil Production
- Tight Oil Activity and Production Levels
- Geology
- Engineering
- Play Descriptions
- Bakken/Exshaw Formation (Manitoba, Saskatchewan, Alberta, and British Columbia)
- Cardium Formation (Alberta)
- Viking Formation (Alberta and Saskatchewan)
- Lower Shaunavon Formation (Saskatchewan)
- Montney/Doig Formation (Alberta)
- Duvernay/Muskwa Formation (Alberta)
- Beaverhill Lake Group (Alberta)
- Lower Amaranth Formation (Manitoba)
- Observations
- Appendix A
- Western Canada - Oil Activity (excluding bitumen)
- Western Canada - Tight Oil Activity
- Bakken Formation and related units Tight Oil Activity
- Cardium Tight Oil Activity
- Viking Tight Oil Activity
- Lower Shaunavon Tight Oil Activity
- Lower Amaranth (Spearfish) Tight Oil Activity
- Montney/Doig Tight Oil Activity
- Beaverhill Lake (and related formations) Tight Oil Activity
Foreword
The National Energy Board (the NEB or the Board) is an independent federal regulator whose purpose is to promote safety and security, environmental protection and efficient infrastructure and markets in the Canadian public interest[1] within the mandate set by Parliament for the regulation of pipelines, energy development, and trade.
[1] The public interest is inclusive of all Canadians and refers to a balance of economic, environmental, and social considerations that change as society's values and preferences evolve over time.
The Board's main responsibilities include regulating the construction and operation of interprovincial and international oil and gas pipelines, international power lines, and designated interprovincial power lines. Furthermore, the Board regulates the tolls and tariffs for the pipelines under its jurisdiction. With respect to the specific energy commodities, the Board regulates the export of natural gas, oil, natural gas liquids (NGLs) and electricity, and the import of natural gas. Additionally, the Board regulates oil and gas exploration and development on frontier lands and offshore areas not covered by provincial or federal management agreements.
The Board also monitors energy markets, and provides its view of the reasonable foreseeable requirements for energy use in Canada having regard to trends in the discovery of oil and gas.[2] The Board periodically publishes assessments of Canadian supply and demand of energy and natural gas markets in support of its ongoing market monitoring. These assessments address various aspects of energy markets in Canada. This Energy Briefing Note (EBN), Tight Oil Developments in the Western Canada Sedimentary Basin, is one such assessment. This particular EBN examines the different aspects of shale oil or “tight oil” development in the Western Canada Sedimentary Basin to aid in the public understanding of this emerging resource.
[2] This activity is undertaken pursuant to the Board’s responsibilities under Part VI of the National Energy Board Act and the Board’s decision in GHR-1-87.
If a party wishes to rely on material from this report in any regulatory proceeding before the NEB, it may submit the material, just as it may submit any public document. Under these circumstances, the submitting party in effect adopts the material and that party could be required to answer questions pertaining to the material.
This report does not provide an indication about whether any application will be approved or not. The Board will decide on specific applications based on the material in evidence before it at that time.
Introduction
“Tight oil” or “light tight oil” refers to a recent trend where horizontal drilling and multi-stage hydraulic fracturing[3] are applied to very low permeability[4] light oil reservoirs. The application of this technology has already transformed the natural gas industry in North America over the last decade, where the outlook for natural gas supply has changed from a projected shortage to a position of sufficient abundance to consider exporting volumes as liquefied natural gas. Tight oil development began with the Bakken play in North Dakota and Montana in the United States. By June, 2011, production from the U.S. Bakken play reached nearly 64 000 m³/d (400 000 bbl/d)[5.6], a four fold increase over 2005 levels. Where the Bakken tight oil play stretches into Saskatchewan and Manitoba, production in March, 2011, was over 12 400 m³/d (78 000 bbl/d), with the vast majority of growth occurring since mid-2007. The NEB estimates Canadian tight oil production, at March, 2011, to be over 25 400 m³/d (160 000 bbl/d).
[3] Multi-stage hydraulic fracturing is a procedure where segments of the well are isolated and fracked one stage at a time, in effect creating one long section of fractured reservoir.
[4] Permeability, for this report, is defined as the ability of a fluid to move through a porous substance.
[5] North Dakota oil production statistics
[6] Cubic metres per day (m³/d) and barrels per day (bbl/d) are common ways of reporting oil production.
This report provides a brief background on emerging tight oil resource plays in the Western Canada Sedimentary Basin (WCSB). It includes descriptions of the geology, current activity and production levels, and estimates of resources and reserves where available. Appendix A provides charts that summarize oil well licensing, rig activity and production levels for each individual play analyzed. This report does not address the environmental dimensions of tight oil developments in the WCSB.
Plays highlighted are the:
- Bakken/Exshaw Formation (Manitoba, Saskatchewan, Alberta, and British Columbia)
- Cardium Formation (Alberta)
- Viking Formation (Alberta and Saskatchewan)
- Lower Shaunavon Formation (Saskatchewan)
- Montney/Doig Formation (Alberta)
- Duvernay/Muskwa Formation (Alberta)
- Beaverhill Lake Group (Alberta)
- Lower Amaranth Formation (Manitoba)
The list does not include potential formations, such as the Second White Specks, Nordegg, and Pekisko and others, largely because these new developments are at very early stages.
The development of tight oil resources in the WCSB is still in its infancy. There appears to be an abundance of possible target formations, both those surrounding conventional oil reservoirs, like the muddy Cardium sandstones around the Pembina oil field, and entirely new regional resource plays, like the Duvernay/Muskwa. While this report focuses on eight plays, other plays are also seeing increasing levels of interest and could emerge as important sources of new oil production.
It is too early to estimate with any degree of confidence what the ultimate impact of exploiting tight oil plays in western Canada might be; however, there are some indications. The Alberta Energy Resources Conservation Board’s latest Supply and Demand report[7] estimates that Alberta’s tight oil plays will add an additional 27 000 m³/d (170 000 bbl/d) to conventional light oil production by 2014. In Saskatchewan, tight oil production in the first quarter of 2011 was 14 300 m³/d (90 000 bbl/d), while Manitoba, reached 4 000 m³/d (25 000 bbl/d). Companies have so far identified just over 80 million m³ (500 million barrels) of proved and probable reserves in their plays of interest and not all companies active in those plays have issued formation-specific reserves (Table 1). This is enough oil to provide production of about 21 000 m³/d (134 000 bbl/d) over a period of 10 years. As well, the technologies used to develop tight oil will continue to evolve, likely increasing the amount of recoverable oil from these plays.
[7] Energy Resources Conservation Board (ERCB), ERCB ST-98 2011, Alberta’s Energy Reserves 2010 and Supply / Demand Outlook 2011-2020, June 2011.
Figure 1 - Map of the WCSB and location of tight oil land activity and drilling
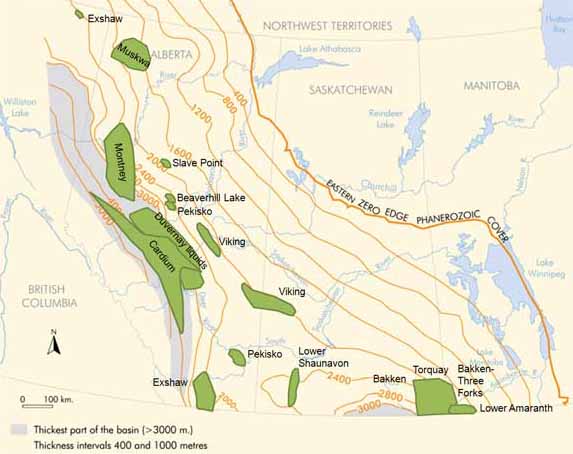
Source: Modified from University of Regina map
According to an assessment by Macquarie Capital Markets Canada Ltd., the shale source rocks in four major tight oil resource plays in Alberta are estimated to contain over 40 billion barrels of original oil-in-place (OOIP).[8] This assessment states that even a small recovery factor, such as one per cent of the total OOIP, would go a long way in extending the productive life of the WCSB.
[8] Macquarie Capital Markets Canada Ltd. Going Straight to the Source, Oct 2010
History of WCSB Light Oil Production
Although there were earlier light oil discoveries in western Canada, such as Turner Valley in 1914, Norman Wells in 1920, and heavy oil at Wainwright in 1923, the giant Leduc discovery in 1947 really marked the beginning of the oil age in western Canada. Output of conventional oil quickly grew, and peaked in 1973 at about 240 thousand m³/d (1.5 million bbl/d). Over the period 1973 to 2007, conventional light oil production in the WCSB has declined about three per cent annually. Since 2002, rapidly growing oil sands production has surpassed conventional light oil production in the WCSB (Figure 2).
Figure 2 - History of Oil and Bitumen Production from Western Canada
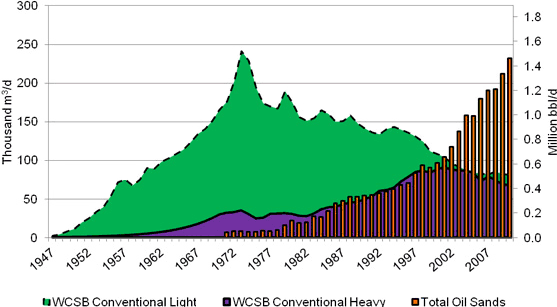
Data Sources: Canadian Association of Petroleum Producers, NEB
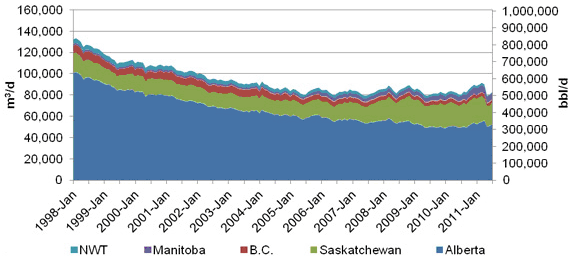
Since about 2005, higher oil prices have given companies incentive to exploit oil-bearing formations from which it had historically been very difficult to achieve commercial production. The application of horizontal drilling and multi-stage hydraulic fracturing to tight oil formations, as has been applied to produce shale gas, has given new life to previously low-producing or unproductive oil reservoirs in the WCSB. This is reversing long-standing decline trends in conventional crude oil, with production at year-end 2010 about nine per cent higher than at year-end 2009 (Figure 3).
Figure 3 - Light crude oil production by province in Western Canada
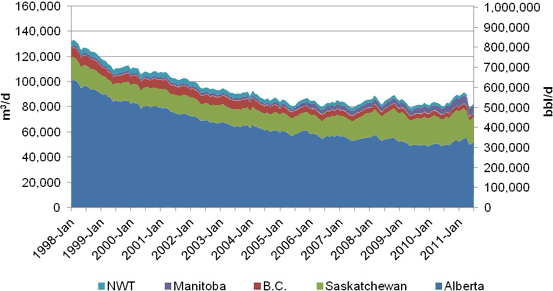
Data Sources: NEB and provincial regulatory agencies
Tight Oil Activity and Production Levels
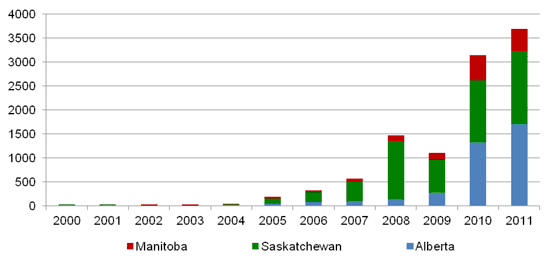
Tight oil development in the WCSB started in the Bakken Formation of southeast Saskatchewan and southwest Manitoba in about 2005, but by 2010 had spread extensively to other plays in the WCSB (Figure 4). Alberta now leads tight oil activity in western Canada because of activity in formations like the Cardium. Industry spending to acquire petroleum rights also increased over this period. In 2008, companies paid the Saskatchewan government over $1.1 billion, a provincial record, largely to acquire Bakken Formation rights. In Alberta, land sales[9] for the year 2011 totaled $3.06 billion by the end of September, and will likely surpass the all-time record of $3.4 billion for oil, gas and bitumen rights set in 2006. Liquids-rich gas opportunities in the Duvernay Shale, as well as oil opportunities in the Cardium and Viking Formations, have largely driven this land sale activity in Alberta.
[9] While often called “land sales”, the granting of petroleum rights is more like leasing, where companies pay a sum of money to acquire the right to produce oil and/or gas from that property. If unsuccessful at their attempts at exploration, the lease expires and is returned to the provincial government.
Figure 4 - Rig Activity in WCSB tight oil plays
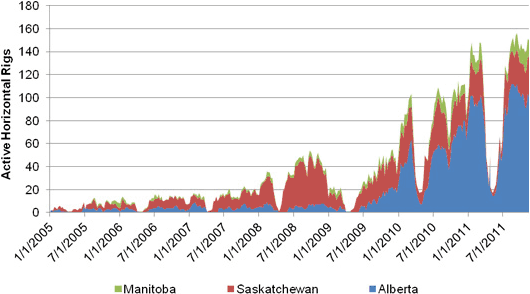
Data source: JuneWarren-Nickle’s Energy Group
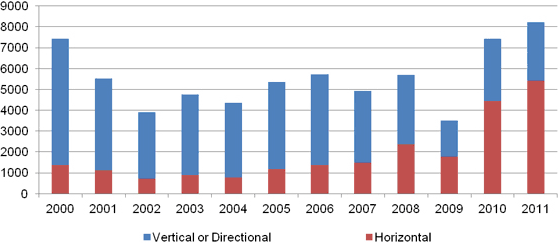
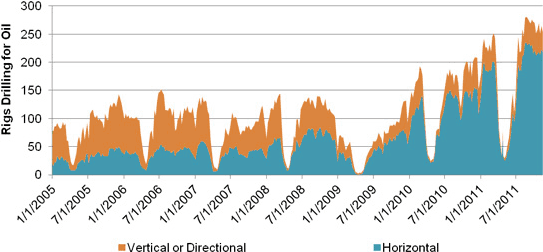
The nature of oil drilling in western Canada has also changed. In 2005, about 28 per cent of oil wells drilled had horizontal legs. By early 2011, this had increased to about 80 per cent. Over the same period, the number of horizontal rigs targeting tight oil increased from 10 rigs to 140.
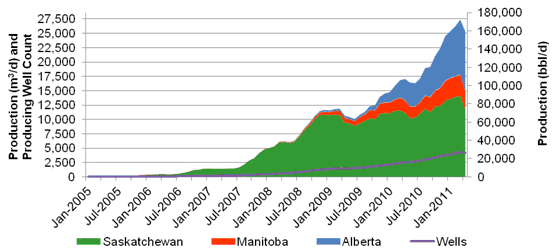
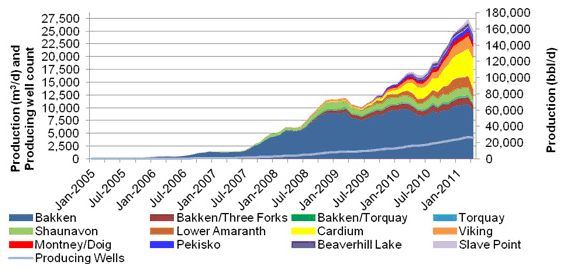
Figure 5 displays the production of tight oil by play. The largest producing formation to date is the Bakken, but by January 2011, its share of tight oil production slipped to about 40 per cent, as the contribution from other plays rapidly grew. Total tight oil production in early 2011 was about 25 400 m³/d (160 000 bbl/d).
Figure 5 - Canadian tight oil production by play
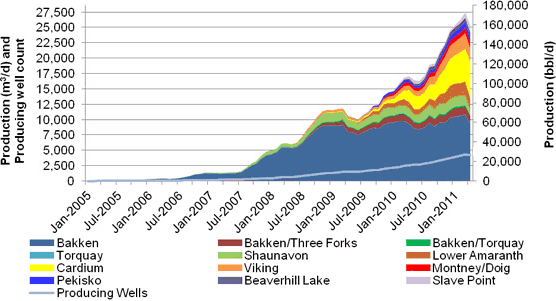
Data source: Divestco
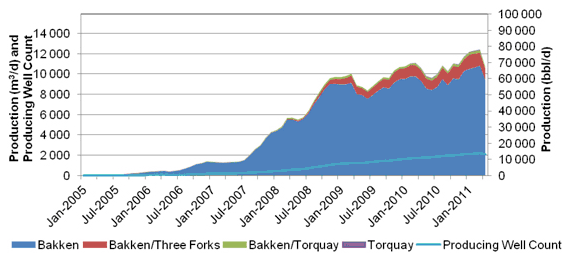
Figure 6 shows the well production profiles for selected wells from four major tight oil plays. Initial rates are quite high, but they decline quickly and stabilize at low decline rates after about 9 to 12 months. The economics of tight oil development benefit from these higher initial production rates and low upfront royalties.[10] Penn West Exploration, one of the most active developers of tight oil plays, estimates that at an oil price of $US85 (WTI), the internal rate of return for these plays can range from 30 to 70 per cent.[11] Payout times are relatively short, varying from nine months to two years.
[10] In Saskatchewan, the first 38,000 barrels are royalty-free. In Alberta a five per cent royalty applies to the first 50,000, 60,000, or 70,000 barrels, depending on well specifics.
[11] Penn West Exploration. Unlocking energy (Barclays Capital CEO Energy-Power Conference), September 2011.
Figure 6 - Tight Oil Well Production Profiles
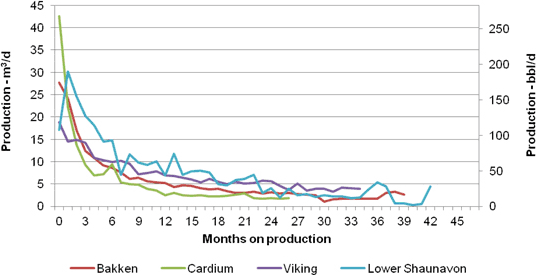
Data source: Divestco
Geology
Oil and Gas Generation
When source rocks (such as coals, which are simply fossilized peats, and organic-rich shales) are deeply buried and subject to high temperatures, hydrocarbons (oil and gas) can be formed from the organic matter. Oil is generated at cooler temperatures than natural gas, in a temperature range termed the “oil window”, at about 100 °C. Importantly, the temperature and how much oil and gas are generated vary as conditions change, and no two source rocks are the same in this regard. For example, source rocks rich in leafy and woody material, like coals, typically do not produce any oil but may contain considerable amounts of natural gas. Meanwhile, source rocks rich in algae can produce significant amounts of oil. Since it is possible to measure the temperatures that organic-rich rocks have been exposed to and determine the composition of the organic matter, companies looking for oil can prospect for oil-prone source rocks that have been heated into the oil window.
Tight Oil Reservoirs
Oil and gas in conventional sandstone, limestone, and dolostone[12] reservoirs typically flow through pore spaces and sometimes through natural fractures in the rock. In tight[13] versions of these rocks, however, the amount of pore space, the size of the pores, and/or the extent to which the pores interconnect are significantly less than in conventional reservoirs and production of oil and gas is more difficult.
[12] Dolostone is created when the calcium in a limestone is replaced by magnesium, often generating additional porosity.
[13]
“Tight” refers to a rock’s natural inability to flow oil and/or gas because of poor reservoir quality.
Conventional reservoirs also tend to be isolated pods of oil-bearing and gas-bearing rock, where the buoyant oil and/or gas collect in updip areas above water-bearing rock. Tight oil accumulations, in a similar fashion to tight gas, shale gas and coalbed methane, are sometimes called “continuous” resources because they tend to be spread over wide areas and there is no downdip water. While there can be a significant amount of oil and gas in these continuous resources, often millions of barrels of oil per section[14], the difficulty until recently has been to extract even a small amount of it.
[14] A section is based on the Dominion Land Survey (township-range grid system) for dispensing land in western Canada during settlement. One section is equal to one square mile.
There are two main types of tight oil (Figure 7):
- Oil found in the original shale source-rock, similar to shale gas[15] and typically called “shale oil”.[16] Shales typically have the lowest reservoir quality of oil- and gas-bearing rocks, with microscopic pore spaces that are very poorly connected to one another; and,
- Oil that has migrated out of the original shale source rock into nearby or distant tight sandstones, siltstones, limestones, or dolostones. This is similar to tight gas plays, which have been exploited in western Canada over the past few decades. These tight rock types typically have better reservoir quality than shales, with more porosity and larger pores, but are still lower quality than conventional reservoirs.
[15] For further information: National Energy Board (NEB). A Primer for Understanding Canadian Shale Gas, 2009.
[16] “Shale oil” is different from an “oil shale”. The term “oil shale” is a misnomer because there is very little oil in it. An oil shale is rich in organic matter from which oil can be generated and, if artificially heated, can generate oil. The Green River Shale of the western United States is an example of an oil shale.
Figure 7 - Conventional, tight, and shale gas and oil
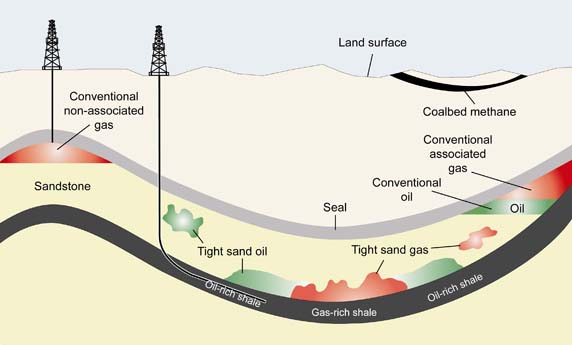
Source: Modified from Energy Information Administration and United States Geological Survey
Engineering
Well Design
Figure 8 - Typical well design
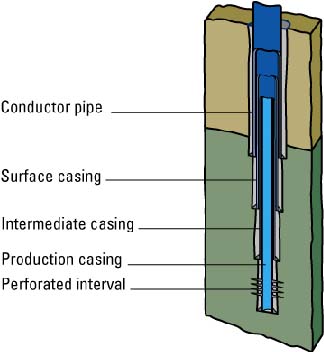 Wells are typically drilled in a few stages (Figure 8). Before any drilling is done, a conducter pipe may be driven into the ground to keep the surface sediments and soils from falling into the well as it is drilled. Drilling continues down to below potable groundwater zones. Then, surface casing is cemented into place, a procedure where a steel pipe is lowered down the hole and cement is poured around it. The operator will then drill through the bottom of the surface casing and down to the well’s final depth, after which production casing is lowered down the well and cemented into place. Both surface and production casing prevent the walls of the well from collapsing into the hole, in addition to protecting groundwater from contamination. Sometimes wells are drilled with additional stages and intermediate casing is run between the surface casing and production casing stages. To access a targeted formation behind the casing, perforations will be punched through it.
Currently, the majority of wells drilled in western Canada are horizontal wells, where the operator drills down to a certain depth, then “kicks” out sideways to drill what is called the horizontal leg. The vertical depth in emerging tight oil plays in western Canada is anywhere from 600 to 2900 metres, and the horizontal legs are anywhere from a few hundred metres to two kilometres long. Often, the production casing is only run to the start of the horizontal section of the well and the horizontal leg is left uncased, allowing for “open-hole” completions, where no perforations are needed to access the targeted formation. The advantage of the horizontal leg is that it greatly increases the contact of the well to the subsurface layer containing oil or gas. In a vertical well, the exposure area is just the circumference of the well multiplied by the length of the perforated interval. In a horizontal well, the exposure area can be its circumference multiplied by the length of the horizontal leg.
Well Completion
When an oil well does not produce at economic rates or has tested poorly, even in conventional reservoirs, it can be stimulated with the intention to increase flow rates to economic levels. For example, hydraulic fracturing (commonly called fraccing or fracking in industry jargon) has been used to increase production from the conventional oil reservoirs of the Pembina field since the 1950s. The practice has also been used in tight gas reservoirs in Canada for the past few decades and has been applied to shale gas reservoirs over the past six years.
Figure 9 - Multi-stage hydraulic fracturing in horizontal and vertical wells
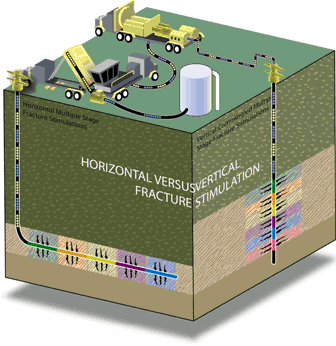 In hydraulic fracturing, a fluid (commonly water, but could be carbon dioxide, nitrogen, or even propane) is pumped down a well and into the targeted formation until the fluid pressure surpasses the rock’s strength and the rock cracks in the vicinity of the well, creating a new fracture system through which oil and gas can flow into the well. For tight oil, as for shale gas and some emerging tight gas plays, operators are combining multi-stage hydraulic fracturing with horizontal drilling (Figure 9), which allows a horizontal well to be exposed to just as much reservoir as would a series of singly fractured vertical wells. Some companies are now reporting the ability to complete up to 60 frack stages in a well, which greatly exceeds the maximum of 20 reported just two or three years ago.
Development Schemes
Because of the continuoas operations. However, to date it appears that for tight oil three or fewer wells are being dus nature of the resource when compared to conventional reservoirs, companies tend to develop their tight oil properties with significant amounts of planning with respect to well spacing, well lengths, and frack sizes so the resource can be recovered as efficiently as possible. For example, in the Bakken, the most mature of the tight oil plays in Canada, some companies are using well spacing of three wells per section while others are using up to eight wells per section, with most using four wells per section. Frack sizes will likely depend on the well spacing, with larger fracks (using more pressure, fluid and proppant to extend the cracks further) required where fewer wells are used and smaller fracks where more wells are used. Or, at a later stage, additional wells may be drilled between existing wells in a practice called downspacing. Some companies are already proposing enhanced oil recovery schemes in some areas, potentially using water floods, or even natural gas floods, to sweep more oil out of the reservoir.
Operators are increasingly making use of multi-well drilling pads, where they can drill two or more wells from the same wellsite, with up to 16 wells drilled from the same well pad in some Canadian shale grilled per multi-well pad.
Play Descriptions
This section provides a description of the geology, as well as estimates of recoverable reserves and initial production rates, where available, for the eight major tight oil plays that are the focus of this report. Table 1 summarizes several of these parameters.
Table 1- Summary of Tight Oil Formations in Western Canada
| Formation | Bakken/ Exshaw | Cardium | Viking | Lower Shaunavon | Montney/ Doig | Duvernay/ Muskwa | Beaverhill Lake | Lower Amaranth |
|---|---|---|---|---|---|---|---|---|
| Type | Tight | Tight | Tight | Tight | Tight | Shale | Tight | Tight |
| Province | MB/SK/ AB/BC | AB | AB/SK | SK | AB | AB | AB | MB |
| Related Conventional Production? |
Yes | Yes | Yes | Yes | Yes | No | Yes | Yes |
| Typical depths - m |
900-2500 | 1200-2300 | 600-900 | 1300-1600 | 800-2200 | 2000+ | 2000-2900 | 800-1000 |
| Reported Reserves - million m³ (million bbl) |
36 (225) | 21 (130) | 9 (58) | 15 (93) | - | - | - | - |
| Typical initial production rates per well - m³/d (bbl/d) |
20-40 (120-250) |
25-80 (150-500) |
15-30 (100-200) |
15-40 (100-250) |
30-95 (200-600) |
unknown | 50-320 (250-2000) |
15-30 (100-200) |
Bakken/Exshaw Formation (Manitoba, Saskatchewan, Alberta, and British Columbia)
The Bakken Formation in Saskatchewan and Manitoba, and the Exshaw Formation in Alberta and British Columbia, are essentially the same rock formation with different names. They are part of a relatively thin accumulation of siltstone and sandstone sandwiched between organic-rich shales extending over much of western Canada. They were deposited as the Devonian Period transitioned into the Mississippian Period, approximately 360 million years ago.[17]
[17] Caplan, M.L., and Bustin, R.M., 1998. Sedimentology and sequence stratigraphy of Devonian-Carboniferous strata, southern Alberta. Bulletin of Canadian Petroleum Geology, v. 45, p. 487-514.
The Bakken/Exshaw tight oil play is about 25 metres thick and consists of a lower organic-rich shale, a middle siltstone and sandstone unit, and an overlying organic-rich shale (Figure 10). The lower black shale was deposited during high sea levels. Sea levels fell and nearshore silts and sands were deposited in what had once been deeper waters. Later, sea level rose and led to the deposition of a deep-water, black shale over the middle unit.[18]
[18] Saskatchewan Ministry of Energy and Resources, 2010. The Bakken revisited: Facies analysis of North America’s most active oil play. Prospect Saskatchewan Issue No. 6. 4 p.
Figure 10 - Bakken Stratigraphy
| Stratigraphy | Lithology | Sea Level |
|---|---|---|
| Souris Valley Beds |
||
| Bakken Formation Upper Member |
 |
 |
| Bakken Formation Middle Member Unit 'C' |
 |
|
| Bakken Formation Middle Member Unit 'B' |
 |
 |
| Bakken Formation Middle Member Unit 'A' |
 |
|
| Bakken Formation Lower Member |
 |
|
| Three Forks Group | ||
 |
 |
|
Source: Saskatchewan Ministry of Energy and Resources
The lower and upper shales also extend into North Dakota, where they were heated to high temperatures during burial, resulting in the generation of oil and gas from the organic matter. The oil and gas entered the siltstones and sandstones in the middle of the formation, the main reservoir interval, and migrated into Saskatchewan and Manitoba.
While widespread, the Bakken/Exshaw Formation is not prospective across the entire formation as reservoir conditions vary widely. Currently, tight oil production from this formation is almost entirely from the Williston Basin of Saskatchewan and Manitoba, although it is being tested in southwest Alberta and in northeast British Columbia. So far, companies have publicly reported 36 million m³ (225 million barrels) of proved and probable reserves[19] from the Bakken. No reserves from the Exshaw have been publicly reported. Where the Bakken extends into North Dakota and Montana, the United States Geological Survey estimates that there are 580 million m³ (3.65 billion barrels) of recoverable oil[20], though the areal extent of oil-prone Bakken in the United States is far more extensive than in Saskatchewan.
[19] Proved and probable reserves for a company are the expected recoverable oil and gas based on their drilled properties and results to date. Given that only a few companies publicly report their reserves for individual formations, and some areas may be excluded because they haven’t been drilled, it is likely that total reserves will be much higher in reality.
[20] United States Geological Survey (USGS). Assessment of Undiscovered Oil Resources in the Devonian-Mississippian Bakken Formation, Williston Basin Province, Montana and North Dakota, 2008.
In some areas in southeast Saskatchewan and southwest Manitoba, the Bakken lies on top of the Torquay and Three Forks Formations, which are also prospective, and the formations are drilled and fracked together to commingle their oil production.
Cardium Formation (Alberta)
The Cardium Formation (deposited in the Late Cretaceous, approximately 88 million years ago) consists of interbedded sandstone and shale, and some local conglomerate, spread over much of western Alberta.[21] Over the past fifty years, conglomerates and porous sandstones have been targeted for conventional production of oil, mainly from the Pembina Field.[22] The Cardium Formation in Alberta is estimated to have contained 1 678 million m³ (10.6 billion barrels) of oil originally in place, 1 490 million m³ (9.4 billion barrels) of which was in the Pembina Field. Since its discovery in the 1950s, 234 million m³ (1.5 billion barrels) of Cardium oil has been produced as of year-end 2010.
[21] Krause, F.F., et al., 1994. Chapter 23, Atlas of the Western Canada Sedimentary Basin.
[22] Energy Resources Conservation Board (ERCB). Annual Reserves Data. June 2011.
The Cardium Formation has been interpreted to be the deposits of a coastal system (Figure 11).[23] Periodically, the sea level fell and deposited shoreline conglomerates and sandstones (what became the conventional oil reservoirs) on the muddy sea floor. Thus, much of the area around the fringe of these conglomerate bodies consists of low-permeability, muddy sandstone and has marginal reservoir quality only now being targeted. One estimate suggests there could be an additional 159 106m³ (1.0 billion barrels) to 477 106m³ (3.0 billion barrels) of oil in place around these fringes.[24] So far, companies have publicly reported 21 million m³ (130 million barrels) of proved and probable reserves from these new areas of the Cardium.
[23] Plint, AG. 1988. Sharp-based shoreface sequences and “offshore bars” in the Cardium Formation of Alberta: their relationship to relative changes in sea-level. In Sea-level Changes: An Integrated Approach, SEPM Special Publication Vol. 42, pp. 357-370.
[24] New Technology Magazine. Amid plenty of debate, unconventional resource players search for the best approach to horizontal, multifrac wells, August 2011.
Figure 11 - Map of dispositional setting during Middle Cardium shale deposition
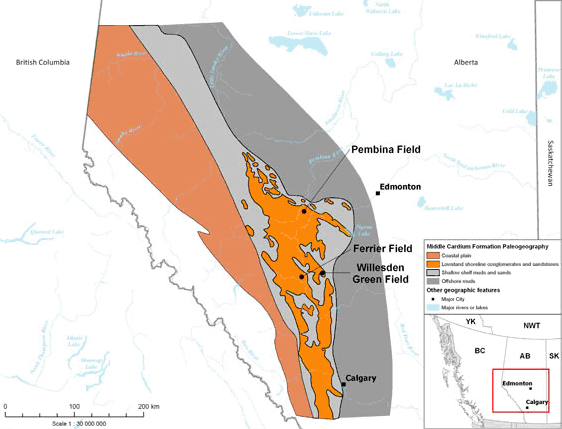
Source: modified from Atlas of the Western Canada Sedimentary Basin
Viking Formation (Alberta and Saskatchewan)
The Viking Formation is also interpreted to be a coastal system that was deposited during the Lower Cretaceous (about 100 million years ago) in a similar manner to the Cardium Formation. The sea level periodically fell and caused deposition of shoreline sands on what was the sea floor, creating what would become conventional sandstone oil reservoirs (Figure 12).[25] Like the Cardium, muddy sandstones of the sea floor surrounding existing oil pools are new targets. The Viking is shallower in many places, generally less than 800 metres in the Dodsland and Redwater areas, which means drilling costs can be reduced, but can also present challenges to horizontal drilling. So far, companies have reported about 9.2 million m³ (58 million barrels) of proved and probable reserves in the Viking.
[25] Reinson, G.E., et al. 1994.Chapter 21, Atlas of the Western Canada Sedimentary Basin.
Figure 12 - Schematic of Viking Formation stratigraphy
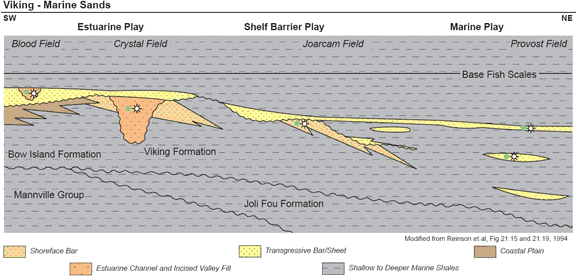
Source: Canadian Discovery
Lower Shaunavon Formation (Saskatchewan)
The Shaunavon Formation is a variable mix of limestone, shale, and minor sandstone deposited in the Williston Basin of Saskatchewan in the Middle Jurassic (approximately 165 million years ago).[26] While the Upper Shaunavon of the Williston Basin’s Swift Current Platform in western Saskatchewan has been a target for conventional petroleum exploration for decades, the Lower Shaunavon’s lime mudstone is an emerging tight oil play. Here, porosity developed in the topmost few metres, creating a low permeability reservoir. In the southwest corner of the province, the Lower Shaunavon is 20 to 35 metres thick, though this decreases to zero at the northern erosional edge of the formation. The lime mudstone was deposited in shallow waters of an interior sea. Crescent Point Energy has estimated that there are 636 million m³ (4 billion barrels) of oil in place in the Lower Shaunavon.[27] Companies have publicly reported about 15 million m³ (93 million barrels) of reserves.
[26] Marsh, A., and Jensen, G. Geology of the Jurassic Shaunavon Formation, southwestern Saskatchewan, Canada. Canadian Society of Petroleum Geologists Annual Conference abstract, 2010.
[27] Crescent Point Energy Corp. Core Operating Areas.
Montney/Doig Formation (Alberta)
The Triassic Montney and Doig Formations were deposited in western Alberta and northeast British Columbia (Figure 13) in the Early to Middle Triassic (approximately 240 million years ago).[28] The Montney Formation consists of shallow-water sands in the east and deep-water muds in the west. The Doig Formation overlies the Montney and consists largely of shallow water sands and muds that filled the remainder of the Montney Basin. Organic-rich muds in the Montney and Doig became heated once buried and generated oil and gas that is the source for conventional shallow-water and deep-water Montney reservoirs. Exploitation of these reservoirs has occurred for decades, but attention shifted to the deep-water mudstones of the Montney as explorers sought shale gas.[29] More recently, explorers have moved into less thermally mature mudstones to explore for oil.
[28] Edwards et al.,1994. Chapter 16, Atlas of the Western Canada Sedimentary Basin.
[29] For further information: National Energy Board (NEB). A Primer for Understanding Canadian Shale Gas, 2009.
Figure 13 - Montney depositional environment and distribution
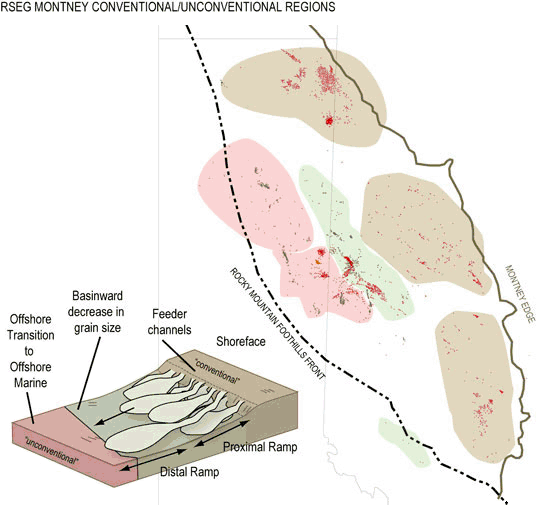
Source: Ross Smith Energy Group
Duvernay/Muskwa Formation (Alberta)
The Duvernay and Muskwa Shales are the same formation, but named differently in different areas: the shale is called the Duvernay in central Alberta and called the Muskwa in northwest Alberta and Northeast British Columbia.[30] The shale was deposited in marine basins between tall reefs and a large, shallow water carbonate platform that grew in the mid-Devonian (Figure 14). The Duvernay has long been known as the organic-rich source rock for the oil and gas in the Leduc reefs surrounding it, some of the largest and first oil discoveries in western Canada.
[30] Witzer, et al., 1994. Chapter 12, Atlas of the Western Canada Sedimentary Basin.
Figure 14 - Map of depositional setting during Duvernay shale deposition
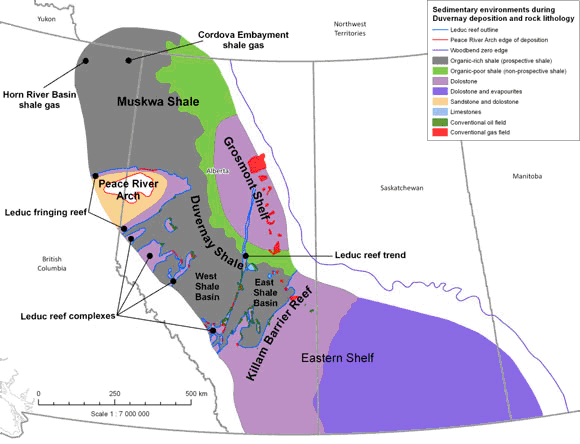
Source: modified from Atlas of the Western Canada Sedimentary Basin
The Muskwa Shale is already being exploited for natural gas in the Horn River Basin of northeast British Columbia as shale gas.[31] In Alberta, bituminous (organic-rich) shales of the Duvernay and Muskwa are gaining interest, not just for shale gas, but also for oil. In particular, it appears that, in many areas toward the east and southeast the formation is more oily, or at least the gas is “wet” (i.e. contains petroleum liquids similar to very light oil).
[31] For further information: National Energy Board (NEB). A Primer for Understanding Canadian Shale Gas, 2009.
Beaverhill Lake Group (Alberta)
The name “Beaverhill Lake” covers a wide variety of limestones and dolostones that were deposited during the Middle Devonian, some 375 million years ago, when a large carbonate platform was situated in central Alberta (Figures 15 and 16). Shallow seawater swept over fringing reefs at the platform’s edge and into the interior, where tidal banks, patch reefs, and reef aprons were deposited (similar to the modern-day shallow waters around the Yucatan Pensinsula in the Gulf of Mexico and Great Barrier Reef of Australia). When the sea level rose, some areas of the platform interior built upward to match. This occurred as corals built on top of one another to keep in the shallowest water and formed tall reef buildups. However, a wide area of the platform was “drowned” by the higher sea level and formed the new sea-bottom. It then became buried and sealed under marine muds.
Figure 15 - Map of depositional setting during Beaverhill Lake and Slave Point deposition
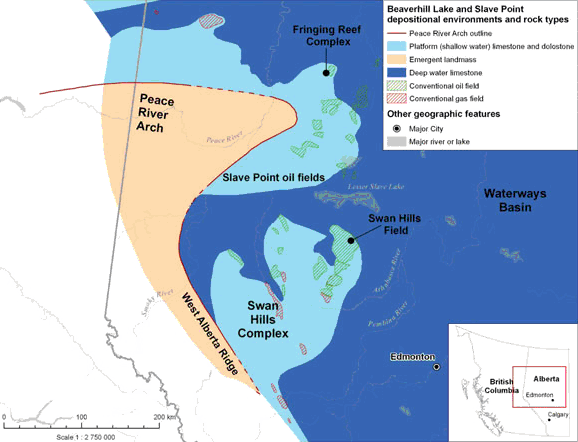
Source: modified from Atlas of the Western Canada Sedimentary Basin
Figure 16 - Swan Hills Field reservoir types
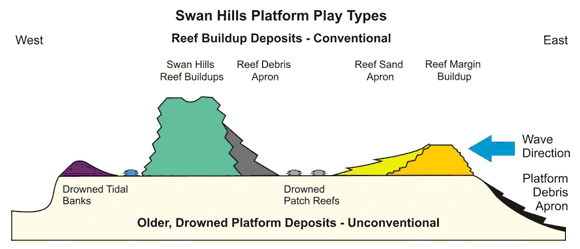
Source: Modified from Swan Hills Platform of West Central Alberta: “The sleeping giant”
Since the 1950s, conventional oil and gas has been produced from the tall reef build-ups which represent some of the largest oil and gas pools ever discovered in western Canada. As an example, the Swan Hills Field had an estimated 458 106m³ (2.9 billion barrels) of oil originally in place and had produced 141 106m³ (0.9 billion barrels) from its discovery to year-end 2010.[32] Other conventional production has come from the fringing reefs at the edge of the old carbonate platform as well as from debris aprons along the edge of the tall buildups. Companies are now exploring around the old drowned platform interior.
[32] Energy Resources Conservation Board. Annual Reserves Data. June 2011.
BMO estimates that there are an additional 397 million m³ (2.5 billion barrels) of oil in place in these potential unconventional developments around the Swan Hills Field.[33] It is highly uncertain, however, what the ultimate recovery will be. In Alberta, the Slave Point Formation, which is stratigraphically equivalent to the Beaverhill Lake tight oil play, has also undergone a limited amount of horizontal drilling and multi-stage hydraulic fracturing in the Otter and Evi Fields, north of the Swan Hills Field.
[33] BMO Capital Markets. Swan Hills Platform of West Central Alberta: “The sleeping giant”, June 2011.
Lower Amaranth Formation (Manitoba)
The Lower Amaranth in Manitoba (known as the Lower Watrous in Saskatchewan and the Spearfish in North Dakota) is a section of sandstone and siltstone deposited on top of a widespread erosional surface that formed during worldwide low sea levels at the beginning of the Triassic.[34] Oil migrated into the Spearfish from underlying oil-rich formations where they overlap at the erosional surface.
[34] LeFever, Julie. The Spearfish Formation - Another Unconventional Target. North Dakota Industrial Commission Department of Natural Resources, January 2011.
Figure 17 - Schematic of Lower Amaranth (Spearfish) stratigraphy
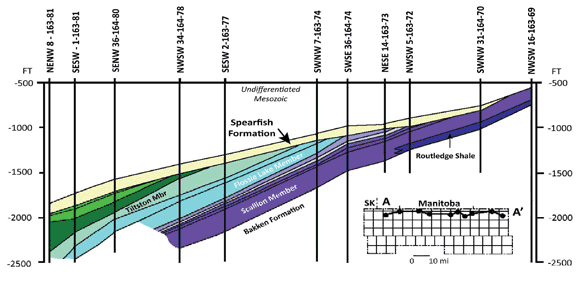
Source: North Dakota Industrial Commission Department of Natural Resources
Observations
Tight oil has the potential to add significant light crude oil production that had not been anticipated just five years ago. While this report examines eight plays, there is increasing interest in other plays that could emerge as important sources of new oil production. New oil supply from tight oil sources has the potential to impact transportation requirements to move WCSB oil production to market. The NEB will continue to monitor tight oil development, along with other trends in the discovery of oil and gas.
Appendix A
Western Canada - Oil Activity (excluding bitumen)
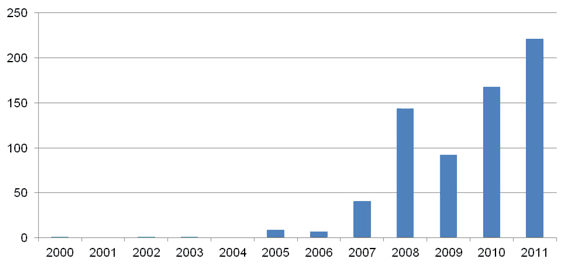
Figure A.1. WCSB Oil Well Licences (excluding bitumen)
2011 data current to end-October. Data Source: JuneWarren-Nickle’s Energy Group
Figure A.2. Canadian Oil Drilling Activity (excluding bitumen)
Data Source: JuneWarren-Nickle’s Energy Group
Figure A.3. WCSB Light Crude Oil Production
Data Source: NEB and provincial regulatory agencies
Western Canada - Tight Oil Activity
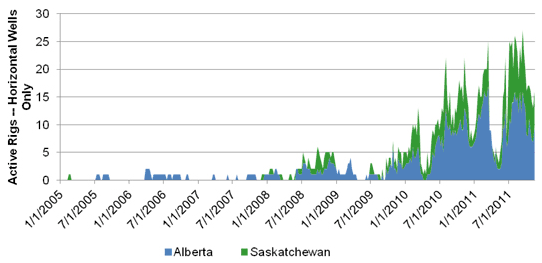
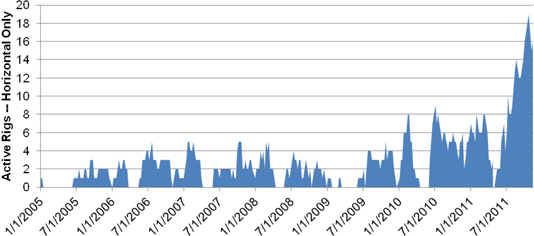
Figure A.4. Tight Oil Licences - Horizontal Only
2011 data current to end-October. Data Source: JuneWarren-Nickle’s Energy Group
Figure A.5. WCSB Tight Oil Drilling Activity

Data Source: JuneWarren-Nickle’s Energy Group
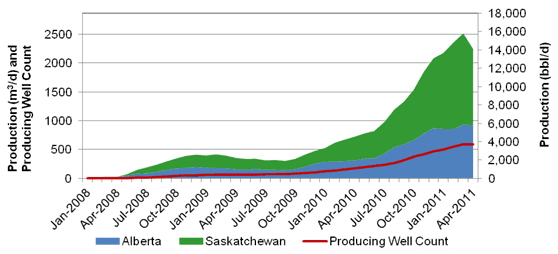
Figure A.6. Canadian Tight Oil Production by Province
Data Source: Divestco
Figure A.7. Canadian Tight Oil Production by Play
Data Source: Divestco
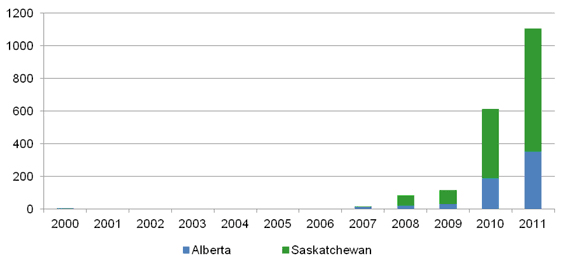
Bakken Formation and related units Tight Oil Activity
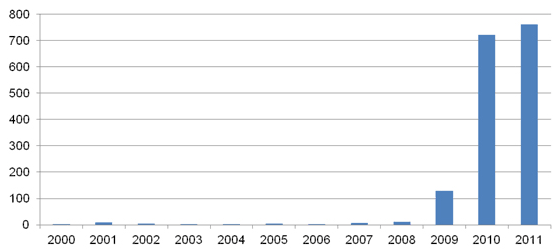
Figure A.8. Bakken, Torquay, and Three Forks Horizontal Oil Well Licences by Province
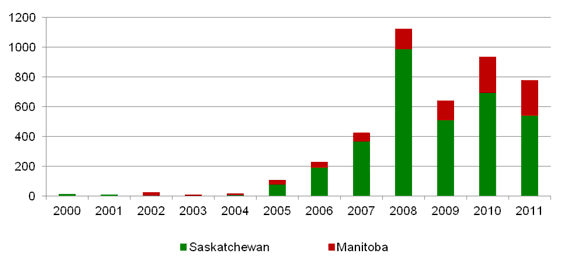
2011 data current to end-October. Data Source: JuneWarren-Nickle’s Energy Group
Figure A.9. Bakken, Torquay, and Three Forks Horizontal Oil Well Licences by Play
2011 data current to end-October. Data Source: JuneWarren-Nickle’s Energy Group
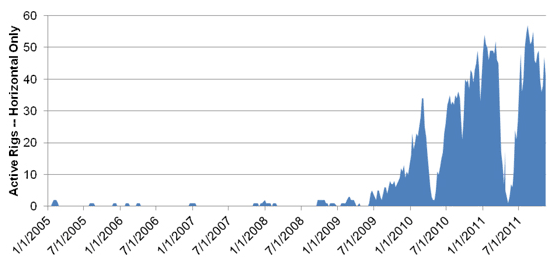
Figure A.10. Bakken, Three Forks, and Torquay Oil Drilling Activity
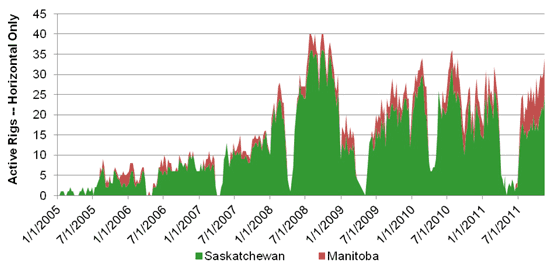
Data Source: JuneWarren-Nickle’s Energy Group
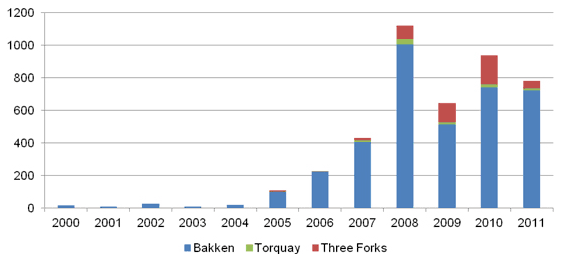
Figure A.11. Bakken, Three Forks, and Torquay Tight Oil Production by Play
Data Source: Divestco
Figure A.12. Bakken, Three Forks, and Torquay Tight Oil Production by Province
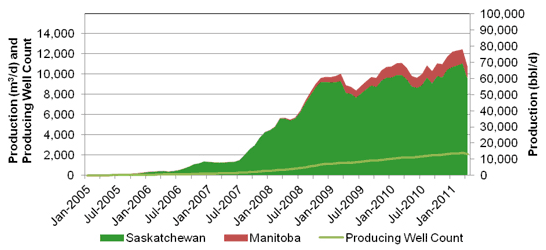
Data Source: Divestco
Cardium Tight Oil Activity
Figure A.13. Cardium Horizontal Oil Well Licences
2011 data current to end-October. Data Source: JuneWarren-Nickle’s Energy Group
Figure A.14. Cardium Oil Drilling Actvity
Data Source: JuneWarren-Nickle’s Energy Group
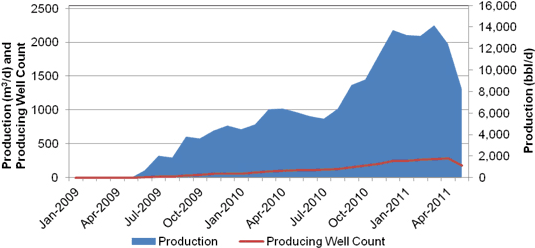
Figure A.15. Cardium Tight Oil Production
Data Source: Divestco
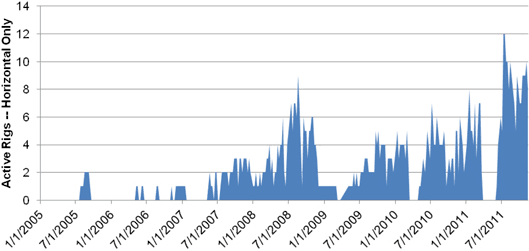
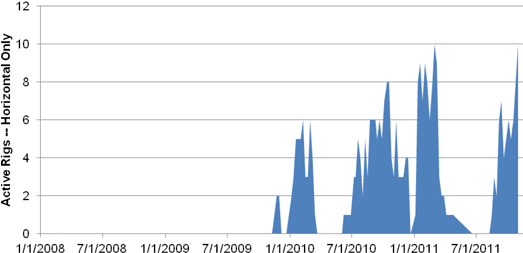
Viking Tight Oil Activity
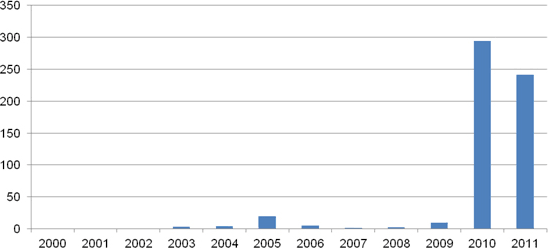
Figure A.16. Viking Horizontal Oil Well Licences
2011 data current to end-October. Data Source: JuneWarren-Nickle’s Energy Group
Figure A. 17. Viking Oil Drilling Activity
Data Source: JuneWarren-Nickle’s Energy Group
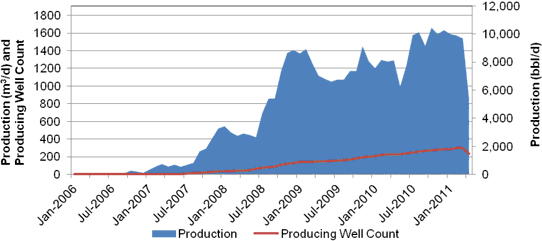
Figure A.18. Viking Tight Oil Production
Data Source: Divestco
Lower Shaunavon Tight Oil Activity
Figure A.19. Shaunavon Horizontal Oil Well Licences
2011 data current to end-October. Data Source: JuneWarren-Nickle’s Energy Group
Figure A.20. Shaunavon Oil Drilling Activity
Data Source: JuneWarren-Nickle’s Energy Group
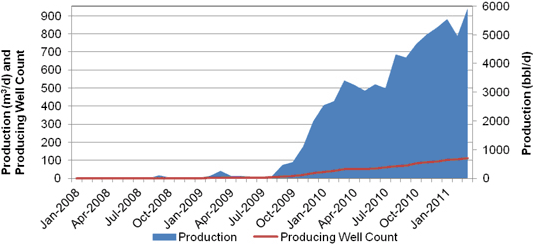
Figure A.21. Shaunavon Tight Oil Production
Data Source: Divestco
Lower Amaranth (Spearfish) Tight Oil Activity
Figure A.22. Lower Amaranth (Spearfish) Horizontal Oil Well Licences
2011 data current to end-October. Data Source: JuneWarren-Nickle’s Energy Group
Figure A.23. Lower Amaranth (Spearfish) Oil Drilling Activity
Data Source: JuneWarren-Nickle’s Energy Group
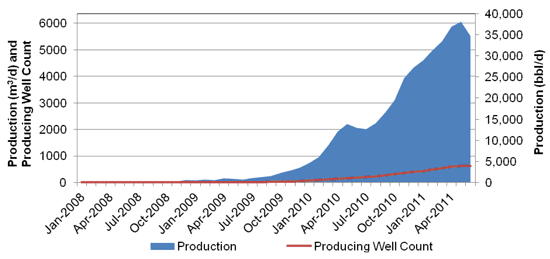
Figure A.24. Lower Amaranth Tight Oil Production
Data Source: Divestco
Montney/Doig Tight Oil Activity
Figure A.25. Montney/Doig Horizontal Oil Well Licences
* Contains many conventional oil licences from 2005 to 2009.
2011 data current to end-October. Data Source: JuneWarren-Nickle’s Energy Group
Figure A.26. Montney/Doig Oil Drilling Activity
Data Source: JuneWarren-Nickle’s Energy Group
Figure A.27. Montney/Doig Tight Oil Production
Data Source: Divestco
Beaverhill Lake (and related formations) Tight Oil Activity
Figure A.28. Beaverhill Lake and Slave Point Horizontal Oil Well Licences
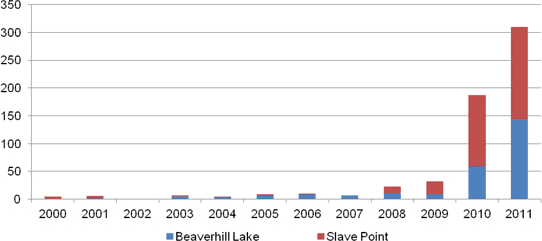
2011 data current to end-October. Data Source: JuneWarren-Nickle’s Energy Group
Figure A.29. Beaverhill Lake and Slave Point Oil Drilling Activity
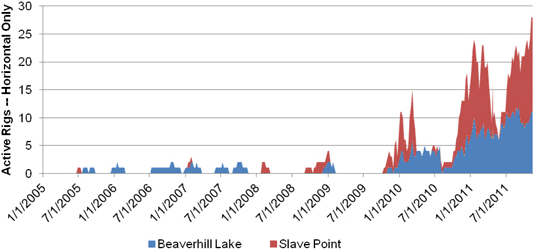
Source Data: JuneWarren-Nickle’s Energy Group
Figure A.30. Beaverhill Lake and Slave Point Tight Oil Production
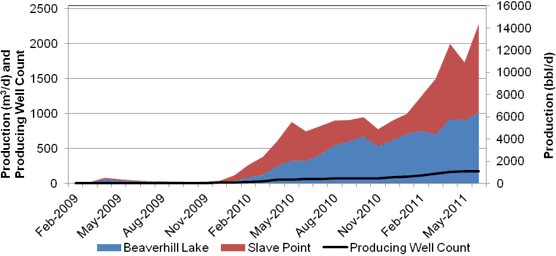
Data Source: Divestco
- Date modified: