ARCHIVED – Canada’s Energy Future 2018 Supplement: Natural Gas Liquids Supply and Disposition
This page has been archived on the Web
Information identified as archived is provided for reference, research or recordkeeping purposes. It is not subject to the Government of Canada Web Standards and has not been altered or updated since it was archived. Please contact us to request a format other than those available.
Canada’s Energy Future 2018 Supplement: Natural Gas Liquids Supply and Disposition [PDF 2166 KB]
Data and Figures [EXCEL 13170 KB]
May 2019
Copyright/Permission to Reproduce
ISSN 2369-1476
Table of Contents
Chapter 1: Background
The National Energy Board’s (NEB) Energy Futures (EF) series explores how possible energy futures might unfold for Canadians over the long term. EF analyses consider a range of impacts across the entire Canadian energy system. In order to cover all aspects of Canadian energy in one supply and demand outlook, the extensive crude oil, natural gas, and natural gas liquids (NGLs) production analyses are described at a relatively high level. A series of supplemental reports is able to address impacts specific to the supply sector, creating an opportunity to provide additional detail.
Natural gas production is a key driver of NGL production, and future natural gas and NGL prices are key drivers of future natural gas and NGL production and key uncertainties to the projections in the Canada’s Energy Future 2018: Energy Supply and Demand Projections to 2040 (EF2018). Natural gas prices could be higher or lower depending on demand, technology, geopolitical events, and the pace at which nations enact policies to reduce GHG emissions. NGL demand and prices are also a key driver in production, exports, and imports of NGL. Details on supply and disposition of NGL are included in this supplement report, as well As its Appendix.
EF analysis assumes that over the long term, all energy produced will find markets. The timing and extent to which particular markets emerge, whether demand growth over/undershoots local production, whether export/import opportunities arise, and whether new transportation infrastructure is built, are difficult to predict. This is why simplifying assumptions are made. The analysis in this supplement report continues the EF tradition of assuming these short-term disconnects are resolved over the longer term.
The EF series of Natural Gas, Crude Oil and NGL supplement reports include four EF cases.
Table 1.1 EF2018 Natural Gas and Crude Oil Production Assumptions/Cases
| Variables | Reference | High Price | Low Price | Technology |
|---|---|---|---|---|
| Oil Price | Moderate | High | Low | Moderate |
| Gas Price | Moderate | High | Low | Moderate |
| Carbon Price | Fixed nominal C$50/t | Fixed nominal C$50/t | Fixed nominal C$50/t | Increasing CO2 cost reaching nominal C$336/t in 2040 |
| Technology Advances | Reference assumption | Reference assumption | Reference assumption | Accelerated |
| Notes | Based on a current economic outlook and a moderate view of energy prices | Since price is one of the most influential factors in oil and gas production, and varies over time, the effects of significant price differences on production are analyzed | Considers the impact of greater adoption of select emerging energy technologies on the Canadian energy system, including technological advances in oil sands production; and the impact on the Canadian energy system of higher carbon pricing | |
This NGL supplement report includes a detailed look at the Reference Case, followed by results from the other three cases. This supplement report includes details on each NGL which includes ethane, propane, butane, pentanes plusFootnote 1, and condensate.
All cases have the same assumption for liquefied natural gas (LNG) exports from British Columbia (B.C.)’s coast. LNG exports start at 0.75 billion cubic feet per day (Bcf/d) in 2025 and double in 2026 to reach 1.50 Bcf/d. Additional volumes are assumed in 2030, increasing total LNG exports to 2.25 Bcf/d in 2030 and 3.0 Bcf/d in 2031. Figure 2.5 in EF2018 shows the assumed LNG export volumes. Additional natural gas production from LNG exports leads to additional NGL production.
This report’s appendix includes 1) a description of the methods and assumptions used to project NGL production, 2) discussions on other supplies and dispositions of NGLs in Canada, and 3) detailed data sets for all cases, including annual natural gas compositions and monthly production for each NGL by stratigraphic and geographic grouping. The Appendix is available in this document, and the data from the Appendix, as well as chart data in this supplement report is also available [EXCEL 13170 KB].
Chapter 2: Reference Case
2.1 Total NGL Production
- NGLs are predominantly produced from processing natural gas, but some are also produced as a by-product of oil refining or bitumen upgrading. Raw natural gas at a wellhead is mostly methane, but often contains other hydrocarbons and some contaminants. These other hydrocarbons often include ethane, propane, butane, condensate and pentanes plus. In 2017 997 thousand barrels per day (Mb/d) of NGLs were produced in Canada.
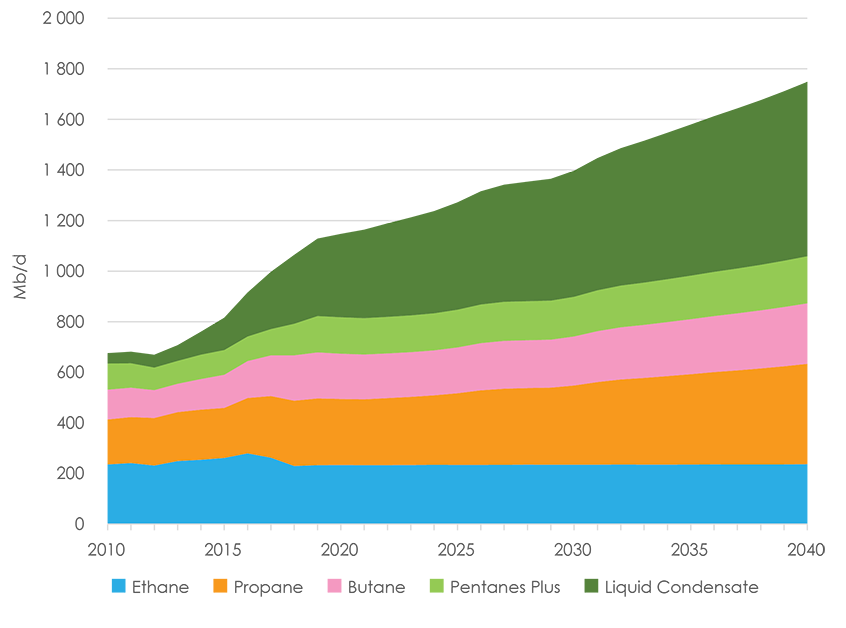
- Total NGL production levels off in the near term as gas production slightly declines, but more NGLs per unit of gas are produced as producers increasingly target areas rich with NGLs, such as the Duvernay shale and Montney tight gas play. NGL production then increases steadily throughout the projections as natural gas production increases. Aggregate NGL production increases by 75% over the projection period, to 1.7 million barrels per day (MMb/d) in 2040.
- Ethane, the majority of which is extracted at large natural gas processing facilities located on major natural gas pipelines in Alberta and B.C., made up 26% of NGL production in 2017, at 262 Mb/d. Ethane production in the Reference Case increases slowly over the projection to 237 Mb/d in 2040, as its recovery from the natural gas stream is assumed to be related to the capacity of petrochemical facilities in Alberta that use it as a feedstock. The remainder of the ethane is not recovered and reinjected back into the gas stream and sold as natural gas.
- Propane production in the Reference Case follows projected natural gas production. As natural gas production begins to increase, propane production begins to increase steadily, and reaches 397 Mb/d by 2040, 63% higher than 2017 levels of 244 Mb/d.
- Butane production follows a similar pattern to natural gas production and is 49% higher than 2017 in 2040, increasing from 161 Mb/d to 239 Mb/d.
- Production of pentanes plus is assumed to occur at natural gas processing plants, and does not include liquid condensate from the wellhead. Pentanes plus increases by 79%, from 104 Mb/d in 2017 to 186 Mb/d in 2040.
- Liquid condensate (or condensate) is produced at a wellhead, and its demand is growing as oil sands production continues to grow. Condensate is mixed with bitumen so the bitumen can flow in pipelines and be loaded into rail cars. High condensate demand has caused gas drilling to focus on NGL-rich plays. Condensate production increased over 265% from 2013 to 2017. Of all the NGLs, condensate production grows the most over the projection period, increasing by 205%, from 226 Mb/d in 2017 to 689 Mb/d in 2040.
Figure 2.1 Total NGL Production
Description:
This graph breaks down the Reference Case projection for Canadian NGL production. Ethane production is projected to increase from 262 Mb/d in 2017 to 237 Mb/d in 2040. Propane production is projected to increase from 244 Mb/d in 2017 to 397 Mb/d in 2040. Butane production is projected to increase from 161 Mb/d in 2017 to 239 Mb/d in 2040. Pentanes plus production is projected to increase from 104 Mb/d in 2017 to 186 Mb/d in 2040. Condensate production is projected to increase from 226 Mb/d in 2017 to 689 Mb/d in 2040.
2.2 Ethane
2.2.1 Ethane Potential and Production by Type of Natural Gas Source
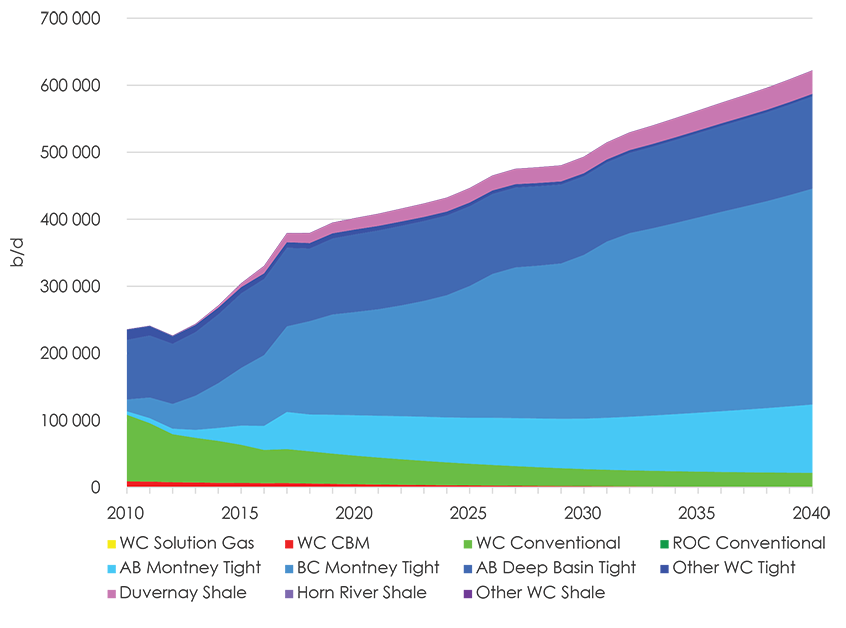
- Production growth from NGL-rich, Montney tight gas over the last six years has led to increased NGL production, and this is expected to continue over the projection. Alberta Deep Basin tight gas production is significant and steady, and also results in significant NGL production.Footnote 2
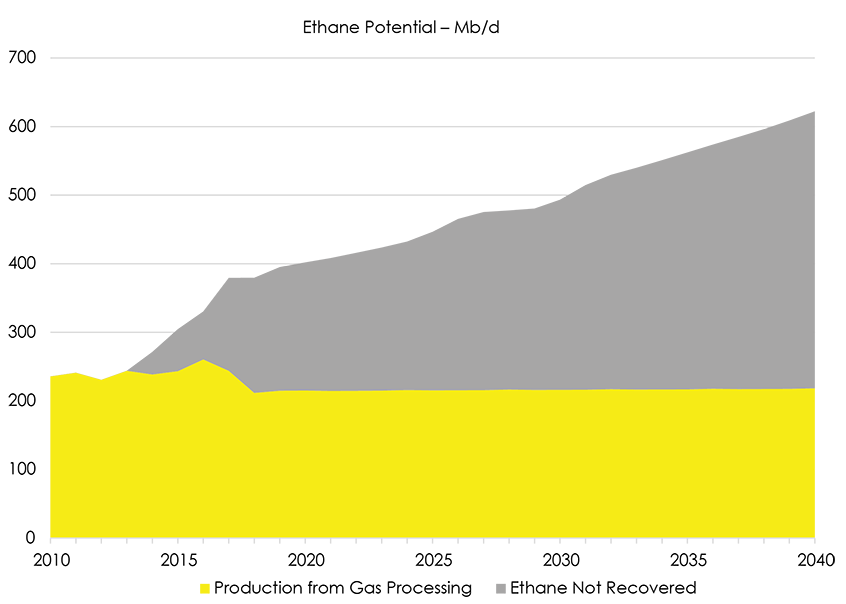
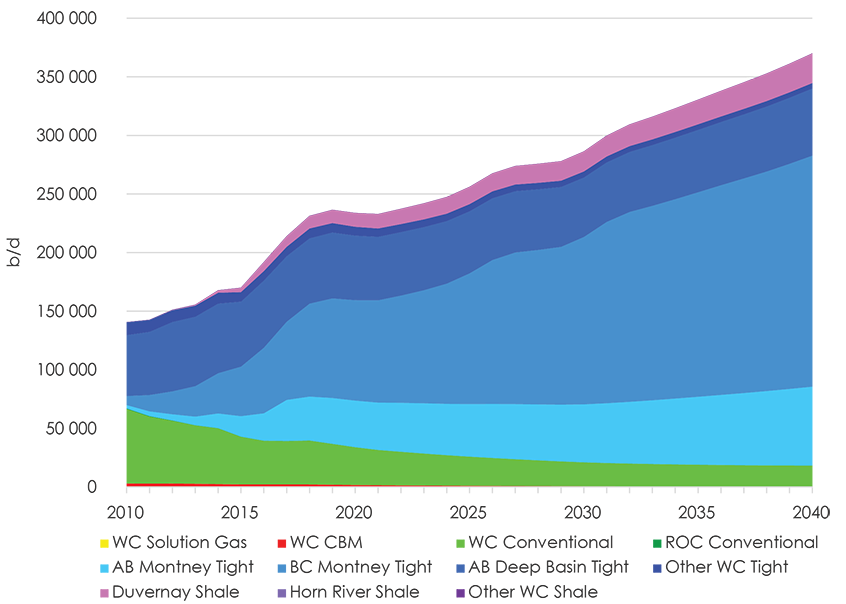
- The majority of ethane comes from tight gas produced in the Montney Formation and Alberta Deep Basin. Canadian ethane production, however, is limited by demand of petrochemical facilities in Alberta and Ontario that use it as a feedstock. Ethane surplus to Canadian demand is reinjected back into the gas stream.Footnote 3 Figure 2.2.1.1 shows total ethane potential, while Figure 2.2.1.2 shows the amount of ethane that is produced and the amount of ethane that is not recovered. Over the projection, as natural gas production grows, ethane potential grows as well.
Figure 2.2.1.1 Ethane Potential by Type of Natural Gas Source
Description:
This graph breaks down the Reference Case projection for Canadian ethane potential by type of natural gas source. Ethane potential from solution gas is zero. Ethane potential from coalbed methane gas production is projected to decrease from 6 400 b/d in 2017 to 644 b/d in 2040. Ethane potential from western Canadian conventional natural gas production is projected to decrease from 50 770 b/d in 2017 to 21 066 b/d in 2040. Ethane potential from the rest of Canada’s conventional natural gas production is zero. Ethane potential from Alberta Montney tight gas production is projected to increase from 55 325 b/d in 2017 to 101 895 b/d in 2040. Ethane potential from B.C. Montney tight gas production is projected to increase from 127 803 b/d in 2017 to 322 143 in 2040. Ethane potential from Alberta Deep Basin tight gas production is projected to increase from 117 104 b/d in 2017 to 137 691 b/d in 2040. Ethane potential from other western Canadian tight gas production is projected to decrease from 8 458 b/d in 2017 to 3 832 b/d in 2040. Ethane potential from Duvernay shale gas production is projected to increase from 13 328 b/d in 2017 to 34 854 b/d in 2040. Ethane potential from Horn River shale gas production is projected to increase then decrease from 136 b/d in 2017 to 127 b/d in 2040. Ethane potential from other western Canadian shale gas production is projected to decrease from 66 b/d in 2017 to 7 b/d in 2040. Total Canadian ethane potential is projected to increase from 379 390 b/d in 2017 to 622 261 in 2040.
Figure 2.2.1.2 Ethane Potential
Description:
This graph breaks down the Reference Case projection for Canadian ethane potential between production and ethane not recovered. Ethane production (via gas processing) is projected to decrease from 244 Mb/d in 2017 to 218 Mb/d in 2040. Ethane not recovered is projected to increase from 135 Mb/d in 2017 to 404 Mb/d in 2040.
2.2.2 Ethane Supply and Disposition
- The majority of ethane supply comes from the processing of natural gas produced in B.C. and Alberta. Upgrading bitumen also produces ethane as a by-product, and that volume is expected to remain constant over the projection.Footnote 4 Imports are based on petrochemical demand. Imports into Alberta from North Dakota via the Vantage pipeline are expected to stay level over the projection. There is no domestic supply of ethane in eastern Canada, so imports into Ontario from Pennsylvania and Ohio via the Genesis and Utopia pipelines are based on Ontario’s petrochemical ethane demand.
- The majority of ethane disposition is petrochemical demand in Alberta and Ontario. While Alberta’s petrochemical capacity expanded in 2016, future expansions are uncertain, so their capacity is held constant and Alberta demand is just over 250 000 b/d over the projection. Ontario’s petrochemical capacity currently consumes 66m000 b/d of ethane, which is assumed to increase in 2019 to 71 000 b/d and up to 93 000 from 2023 onwards.Footnote 5
Figure 2.2.2 Ethane Supply and Disposition
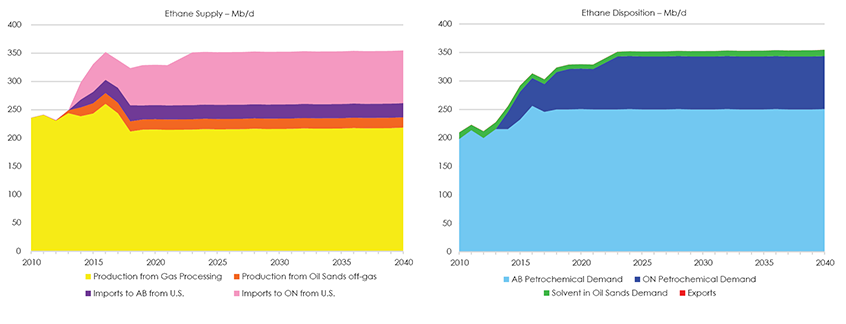
Description:
This graph breaks down the Reference Case projection for Canadian ethane for each supply and disposition. Ethane production from gas processing is projected to decrease from 244 Mb/d in 2017 to 218 Mb/d in 2040. Ethane production from oil sands off-gas is projected to decrease slightly from 19 Mb/d in 2017 to 18 Mb/d in 2040. Ethane imports from the United States (U.S.) to Alberta are projected to decrease slightly from 27 Mb/d in 2017 to 25 Mb/d in 2040. Ethane imports from the U.S. to Ontario are projected to increase from 49 Mb/d in 2017 to 93 Mb/d in 2040. Total Canadian supply of ethane is projected to increase from 338 Mb/d in 2017 to 355 Mb/d in 2040. Alberta petrochemical demand for ethane is projected to increase from 246 Mb/d in 2017 to 251 Mb/d in 2040. Ontario petrochemical demand for ethane is projected to increase from 49 Mb/d in 2017 to 93 Mb/d in 2040. Oil sands ethane demand is projected to increase from 8 Mb/d in 2017 to 11 Mb/d in 2040. Canadian exports of ethane are zero. Total Canadian disposition of ethane is projected to increase from 303 Mb/d in 2017 to 355 Mb/d in 2040.
2.3 Propane
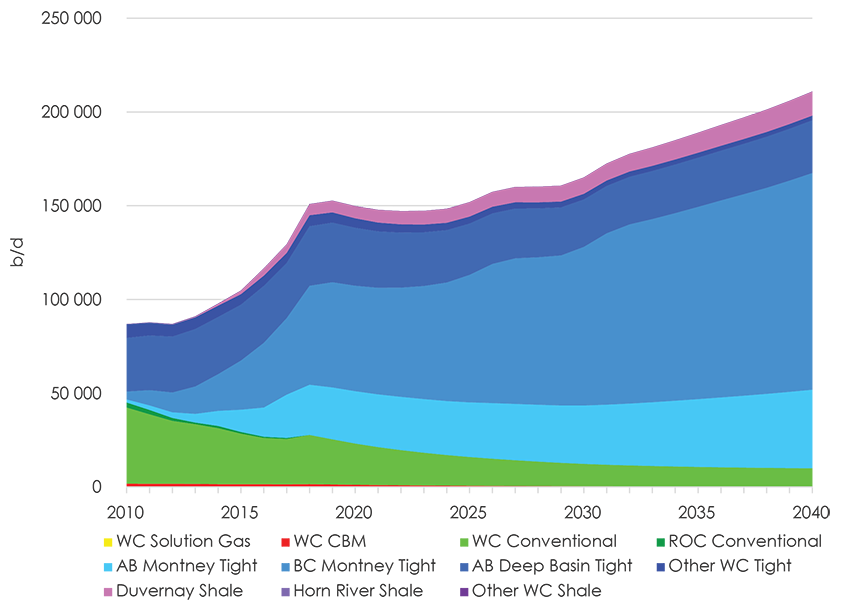
2.3.1 Propane Production by Type of Natural Gas Source
- The majority of propane comes from tight gas produced from the Montney Formation and the Alberta Deep Basin, which have areas that have higher liquids contents. Thus, propane production grows as their natural gas production grows. Figure 2.3.1 shows propane production by major gas sources.
Figure 2.3.1 Propane Production by Type of Natural Gas Source
Description:
This graph breaks down the Reference Case projection for Canadian propane production by type of natural gas source. Propane production from solution gas is zero. Propane production from coalbed methane gas production is projected to decrease from 2 229 b/d in 2017 to 227 b/d in 2040. Propane production from western Canadian conventional natural gas production is projected to decrease from 36 913 b/d in 2017 to 18 043 b/d in 2040. Propane production from the rest of Canada’s conventional natural gas production is projected to decrease from 92 b/d in 2017 zero by 2021. Propane production from Alberta Montney tight gas production is projected to increase from 35 047 b/d in 2017 to 67 325 b/d in 2040. Propane production from B.C. Montney tight gas production is projected to increase from 66 738 b/d in 2017 to 197 192 in 2040. Propane production from Alberta Deep Basin tight gas production is projected to increase from 55 897 b/d in 2017 to 57 289 b/d in 2040. Propane production from other western Canadian tight gas production is projected to decrease from 8 056 b/d in 2017 to 4 685 b/d in 2040. Propane production from Duvernay shale gas production is projected to increase from 9 007 b/d in 2017 to 25 304 b/d in 2040. Propane production from Horn River shale gas production is projected to decrease from 41 b/d in 2017 to 11 b/d in 2040. Propane production from other western Canadian shale gas production is projected to decrease from 43 b/d in 2017 to 10 b/d in 2040. Total Canadian propane production is projected to increase from 214 064 b/d in 2017 to 370 086 in 2040.
2.3.2 Propane Supply and Disposition
- The majority of propane supply comes from processing natural gas produced in B.C. and Alberta. Upgrading bitumen also produces propane as a by-product, and this is expected to stay level over the projection because upgrading is expected to stay level.Footnote 6 Propane production from Canadian refineriesFootnote 7 has declined over the last decade, and will continue to slowly decline over the projection. Propane production from Alberta refineries will increase in 2018 with the startup of the Sturgeon Refinery, and then stay level over the projection, as demand for refined products, which drives refinery production, is projected to remain constant. Propane imports into Alberta from the U.S. are minimal and held constant at 2017 levels. Imports into Ontario from the U.S. are also minimal, though slightly increase over the projection.
- Propane consumption in Canada, as well as propane exports, increases over the projection. Propane demand from Ontario’s petrochemical industry has decreased in recent years, and is held steady over the projection. Propane demand from Alberta’s petrochemical industry is expected to grow starting in 2021.Footnote 8 Propane and butane are also used as solvents in Alberta’s oil sands. Solvents are injected with steam in in situ operations to increase bitumen recovery and reduce water use. Solvent use is expected to increase gradually over the projection. Other uses of propane in Canada, such as from the residential and commercial sectors, are expected to increase gradually with population and economic growth.
- The remainder of supply, shown by the red wedge in Figure 2.3.2’s disposition chart, is projected exports, either via pipeline, pressurized rail tank cars, or by truck. In 2019, propane will also be exported by ship off of Canada’s West Coast.Footnote 9 Exports to the U.S.Footnote 10 have grown over the last decade given growing U.S. petrochemical demand and U.S. propane exports.Footnote 11 Projected Canadian propane exports shrink as demand from Alberta’s petrochemical industry grows in the early 2020s, outpacing propane production growth. However, as propane production grows in later years, so do projected exports.
Figure 2.3.2 Propane Supply and Disposition
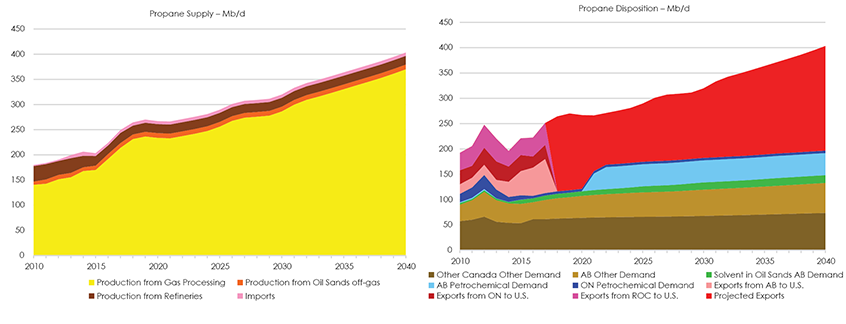
Description:
This graph breaks down the Reference Case projection for Canadian propane for each supply and disposition. Propane production from gas processing is projected to increase from 214 Mb/d in 2017 to 370 Mb/d in 2040. Propane production from oil sands off-gas is projected to decrease slightly from 10 Mb/d in 2017 to 9 Mb/d in 2040. Propane production from refineries is projected to decrease slightly from 20 Mb/d in 2017 to 17 Mb/d in 2040. Propane imports from the U.S are projected to increase slightly from 6 Mb/d in 2017 to 7 Mb/d in 2040. Total Canadian supply of propane is projected to increase from 249 Mb/d in 2017 to 403 Mb/d in 2040. Alberta petrochemical demand for propane is projected to increase from zero in 2017 to 44 Mb/d in 2040. Ontario petrochemical demand for propane is projected to remain at 5 b/d. Oil sands propane demand is projected to increase from 9 Mb/d in 2017 to 15 Mb/d in 2040. Other Alberta propane demand is projected to increase from 38 Mb/d in 2017 to 59 Mb/d in 2040. Propane demand in the rest of Canada is projected to increase from 62 Mb/d in 2017 to 74 Mb/d in 2040. Exports of propane from Alberta to the U.S. in 2017 were 67 Mb/d. Exports of propane from Ontario to the U.S. in 2017 were 28 Mb/d. Exports of propane from the rest of Canada to the U.S. in 2017 were 43 Mb/d. Total Canadian propane exports are projected to increase from 138 Mb/d in 2017 to 206 Mb/d in 2040. Total Canadian disposition of propane is projected to increase from 251 Mb/d in 2017 to 403 Mb/d in 2040.
2.4 Butane
2.4.1 Butane Production by Type of Gas Source
- The majority of butane comes from tight gas production. Butane production grows as natural gas production grows, and as natural gas drilling focuses on natural gas sources with higher liquids content, like the Montney Formation and the Alberta Deep Basin. Figure 2.4.1 shows butane production by major gas sources.
Figure 2.4.1 Butane Production by Type of Natural Gas Source
Description:
This graph breaks down the Reference Case projection for Canadian butane production by type of natural gas source. Butane production from solution gas is zero. Butane production from coalbed methane gas production is projected to decrease from 1 443 b/d in 2017 to 140 b/d in 2040. Butane production from western Canadian conventional natural gas production is projected to decrease from 24 135 b/d in 2017 to 9 862 b/d in 2040. Butane production from the rest of Canada’s conventional natural gas production is projected to decrease from 582 b/d in 2017 zero by 2018. Butane production from Alberta Montney tight gas production is projected to increase from 23 089 b/d in 2017 to 41 865 b/d in 2040. Butane production from B.C. Montney tight gas production is projected to increase from 40 859 b/d in 2017 to 115 632 in 2040. Butane production from Alberta Deep Basin tight gas production is projected to increase then decrease from 29 429 b/d in 2017 to 28 106 b/d in 2040. Butane production from other western Canadian tight gas production is projected to decrease from 5 312 b/d in 2017 to 2 514 b/d in 2040. Butane production from Duvernay shale gas production is projected to increase from 4 488 b/d in 2017 to 12 804 b/d in 2040. Butane production from Horn River shale gas production is projected to decrease from 69 b/d in 2017 to 29 b/d in 2040. Butane production from other western Canadian shale gas production is projected to decrease from 11 b/d in 2017 to 2 b/d in 2040. Total Canadian butane production is projected to increase from 129 417 b/d in 2017 to 210 955 in 2040.
2.4.2 Butane Supply and Disposition
- Most of butane supply comes from processing natural gas produced in B.C. and Alberta. Upgrading bitumen also produces butane as a by-product, and is expected to stay level over the projection.Footnote 12 Like propane, butane production from most Canadian refineries has declined over the last decade, and will continue to slowly decline over the projection. Butane production from Alberta refineries will increase in 2018 with the startup of the Sturgeon Refinery, and then stay level over the projection. Imports into Alberta from the U.S. are minimal and held constant at 2017 levels.
- Domestic consumption of butane gradually increases over the projection. The largest consumers of butane in Canada are refineries, which blend butane with gasoline. Another large consumer of butane is the oil industry. Butane can be used as diluent (butane is blended with bitumen or other heavy oil production so that the bitumen and heavy oil can flow in pipelines). Petrochemical production is not a large consumer of butane, and petrochemical demand for butane has decreased over the last decade as some petrochemical facilities have shifted from using butane to using ethane and propane instead. Butane consumption as a solvent in in situ bitumen production is expected to gradually increase over the projection. The remainder of supply, shown by the red wedge in Figure 2.4.2’s disposition chart, is projected exports, either via pipeline, pressurized rail tank cars, truck, or possibly, starting by 2020, exported as liquefied petroleum gas (LPG) by ship off of Canada’s west coast.
Figure 2.4.2 Butane Supply and Disposition
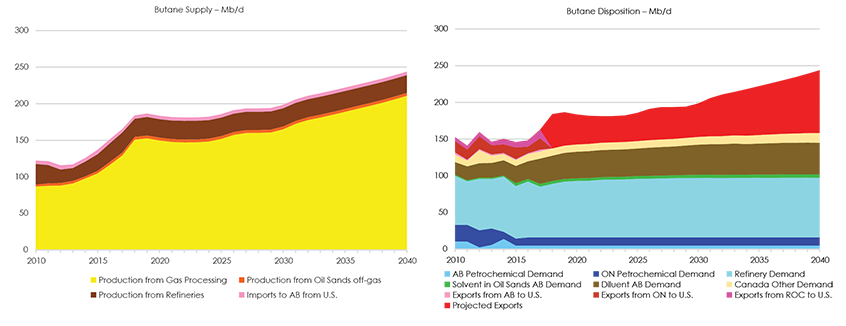
Description:
This graph breaks down the Reference Case projection for Canadian butane for each supply and disposition. Butane production from gas processing is projected to increase from 129 Mb/d in 2017 to 211 Mb/d in 2040. Butane production from oil sands off-gas is projected to remain around 4 Mb/d. Butane production from refineries is projected to decrease slightly from 27 Mb/d in 2017 to 24 Mb/d in 2040. Butane imports from the U.S. are projected to stay around 5 Mb/d. Total Canadian supply of butane is projected to increase from 165 Mb/d in 2017 to 244 Mb/d in 2040. Alberta petrochemical demand for butane is projected to remain around 5 Mb/d. Ontario petrochemical demand for butane is projected to remain at 11 b/d. Refinery demand of butane is projected to increase from 69 Mb/d in 2017 to 81 Mb/d in 2027 and on. Oil sands butane demand, for solvent use, is projected to increase from 4 Mb/d in 2017 to 5 Mb/d in 2040. Use of butane as diluent is projected to increase from 34 Mb/d in 2017 to 43 Mb/d in 2040. Other Canadian butane demand is projected to increase from 10 Mb/d in 2017 to 13 Mb/d in 2040. Exports of butane from Alberta to the U.S. in 2017 were 2 Mb/d. Exports of butane from Ontario to the U.S. in 2017 were 15 Mb/d. Exports of butane from the rest of Canada to the U.S. in 2017 were 12 Mb/d. Total Canadian butane exports are projected to increase from 30 Mb/d in 2017 to 85 Mb/d in 2040. Total Canadian disposition of butane is projected to increase from 163 Mb/d in 2017 to 244 Mb/d in 2040.
2.5 Pentanes Plus and Condensate
2.5.1 Pentanes Plus and Condensate Production by Type of Gas Source
- The majority of pentanes plus comes from tight gas production, and the majority of condensate comes from natural gas produced by the Montney Formation, Alberta Deep Basin tight gas, and Alberta’s Duvernay shale. Pentanes plus and condensate production will continue to grow over the projection as natural gas drilling focuses on liquids-rich natural gas sources. Figure 2.5.1 shows production by major gas sources for pentanes plus and condensate.
Figure 2.5.1 Pentanes Plus and Condensate Production by Type of Natural Gas Source
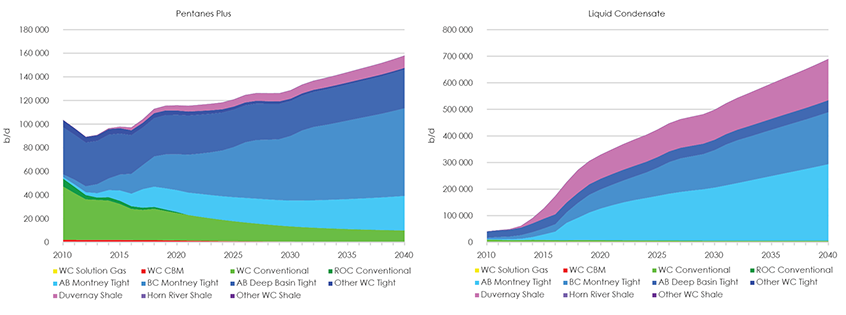
Description:
These two graphs break down the Reference Case projection for Canadian pentanes plus and condensate production by type of natural gas source. Pentanes plus production from solution gas is zero. Pentanes plus production from coalbed methane gas production is projected to decrease from 1 842 b/d in 2017 to 197 b/d in 2040. Pentanes plus production from western Canadian conventional natural gas production is projected to decrease from 25 526 b/d in 2017 to 9 865 b/d in 2040. Pentanes plus production from the rest of Canada’s conventional natural gas production is projected to decrease from 1 958 b/d in 2017 zero by 2021. Pentanes plus production from Alberta Montney tight gas production is projected to increase from 15 681 b/d in 2017 to 29 203 b/d in 2040. Pentanes plus production from B.C. Montney tight gas production is projected to increase from 20 383 b/d in 2017 to 74 205 in 2040. Pentanes plus production from Alberta Deep Basin tight gas production is projected to increase then decrease from 31 739 b/d in 2017 to 32 695 b/d in 2040. Pentanes plus production from other western Canadian tight gas production is projected to decrease from 4 056 b/d in 2017 to 1 476 b/d in 2040. Pentanes plus production from Duvernay shale gas production is projected to increase from 2 821 b/d in 2017 to 10 298 b/d in 2040. Pentanes plus production from Horn River shale gas production is projected to increase from 42 b/d in 2017 to 61 b/d in 2040. Pentanes plus production from other western Canadian shale gas production is projected to decrease from 5 b/d in 2017 to less than 1 b/d in 2040. Total Canadian pentanes plus production is projected to increase from 104 054 b/d in 2017 to 158 001 in 2040. Condensate production from solution gas and coalbed methane is zero. Condensate production from western Canadian conventional natural gas production is projected to decrease from 7 871 b/d in 2017 to 5 921 b/d in 2040. Condensate production from the rest of Canada is projected to stay at zero. Condensate production from Alberta Montney tight gas production is projected to increase from 65 379 b/d in 2017 to 287,928 b/d in 2040. Condensate production from BC Montney tight gas production is projected to increase from 39 497 b/d in 2017 to 195 550 in 2040. Condensate production from Alberta Deep Basin tight gas production is projected to increase then decrease from 37 046 in 2017 to 45 173 b/d in 2040. Condensate production from other western Canadian tight gas production is projected to remain at zero. Condensate production from Duvernay shale gas production is projected to increase from 76 254 b/d in 2017 to 154 921 b/d in 2040. Condensate production from Horn River and other shale gas production is projected to remain at zero. Total Canadian condensate production is projected to increase from 226 047 b/d in 2017 to 689 493 in 2040.
2.5.2 Pentanes Plus and Condensate Supply and Disposition
- The majority of domestic supply of condensate comes from gas production at wellheads while the majority of pentanes plus supply comes from processing natural gas produced in B.C. and Alberta. Pentanes plus production from refineries (which produce pentanes plus as a by–product) is expected to stay level over the projection.Footnote 13
- Condensate and some pentanes plus are used as diluent for bitumen produced in the oil sands and heavy oil produced in Alberta and Saskatchewan. Bitumen and heavy oil production are projected to increase, thus diluent demand is expected to increase over the projection, driving development of natural gas sources rich in NGLs, particularly condensate. Diluent is imported from the U.S. on the Southern Lights and Cochin pipelines. Net imports of diluent is the difference between domestic production of pentanes plus and liquid condensate and the demand for diluent.
- Domestic demand of pentanes plus and liquid condensate will continue to grow as bitumen production in Alberta and heavy oil production in Saskatchewan continue to grow. However in 2033, Suncor’s Firebag and MacKay River SAGD facilitiesFootnote 14 are assumed to stop using diluent when they start using Suncor’s upgrading facilities, lowering overall demand for diluent. The extent to which rail is used as a mode of transportation will also affect diluent demand. Typically, bitumen that is transported via rail requires less diluent than bitumen transported via pipeline
Figure 2.5.2 Pentanes Plus and Liquid Condensate Supply and Disposition
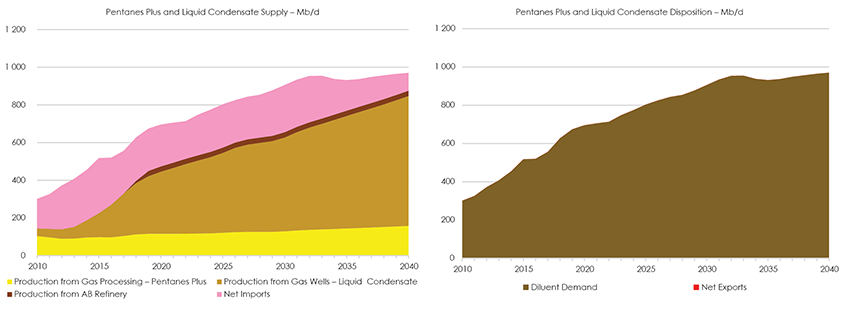
Description:
This graph breaks down the Reference Case projection for Canadian pentanes plus and condensate (or C5+) for each supply and disposition. Pentanes plus production from gas processing is projected to increase from 104 Mb/d in 2017 to 158 Mb/d in 2040. Condensate production from gas processing is projected to increase from 226 Mb/d in 2017 to 689 Mb/d in 2040. C5+ production from refineries is projected to increase from zero in 2017 to 18 Mb/d in 2018, and to 28 Mb/d in 2040. Net imports of C5+ from the U.S are projected to increase from 226 Mb/d in 2017 up to 251 Mb/d in 2030 then decrease to 95 Mb/d in 2040. Total Canadian supply of C5+ is projected to increase from 556 Mb/d in 2017 to 970 Mb/d in 2040. Diluent demand for C5+ is projected to increase from 556 Mb/d in 2017 to 970 Mb/d in 2040. Canada is projected to remain a net importer of C5+ over the projection period in the Reference Case. Total Canadian disposition of C5+ is the same as diluent demand, since net exports are zero.
Chapter 3 – All CasesFootnote 15
- Natural gas prices and production vary between EF2018 cases. Therefore, NGL production varies too. All cases show the same targeting of more economic, NGL-rich resources, which means higher liquids content of natural gas production. LNG exports are assumed to occur in all four cases. Thus, NGL production bumps up in 2025 and 2030 in all cases.
- Even with the lower natural gas production in EF2018’s Low Price CaseFootnote 16, ethane potential is significantly higher than ethane produced at gas plants. Petrochemical demand projections are the same in all cases, including demand for ethane, which is level over the projection. This implies room for additional petrochemical demand of ethane to develop in western Canada.
- Propane production in the High Price Case is higher than the Reference Case, because of higher gas production. Meanwhile, propane demand is higher in the High Price Case than the Reference Case, because of higher demand from the oil sands and other, non-petrochemical Canadian demand. Overall however, propane production growth outpaces propane demand growth in the High Price Case more so than in the Reference Case. This leads to higher projected exports of propane in the High Price Case. There is also potential for domestic petrochemical growth beyond what is assumed in these cases.
- EF2018’s Technology Case has lower natural gas production because of lower natural gas prices in western Canada and higher carbon prices, which means lower Montney tight gas and Duvernay shale gas production. This causes significantly lower diluent production when compared to the Reference Case. This leads to increased imports of diluent to meet blending demand in the Technology Case, more than tripling the import volume by 2040, even with lower oil sands and heavy oil production.Footnote 17
Figure 3.1 NGL Projections by Case
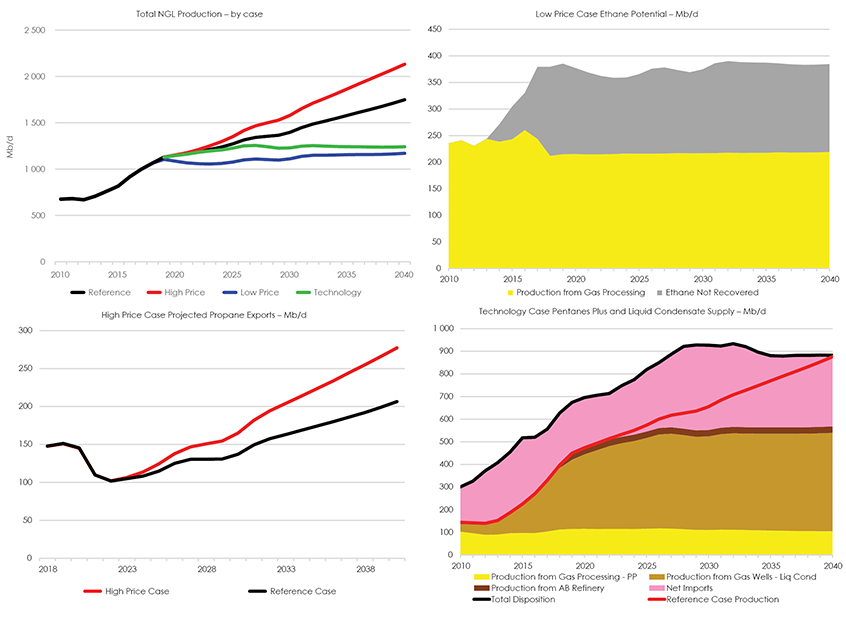
Description:
These four graphs break show some highlights of all cases. Total NGL production is projected to increase from 997 Mb/d in 2017 to 1 748 Mb/d in 2040 in the Reference Case. In the High Price Case, NGL production is projected to increase to 2 132 Mb/d in 2040. In the Low Price Case, NGL production is projected to decrease to 1 170 Mb/d in 2040. In the Technology Case, NGL production is projected to decrease to 1 240 Mb/d. in the Low Price Case, ethane potential is projected to increase from 379 Mb/d in 2017 to 385 Mb/d in 2040, with ethane not recovered increasing from 135 Mb/d in 2017 to 165 Mb/d in 2040. Canadian propane exports totaled 138 Mb/d in 2017. In 2040 they reach 206 Mb/d in the Reference Case and 277 Mb/d in the High Price Case. In the Technology Case pentanes plus from gas processing is projected to increase from 104 Mb/d in 2017 to 118 Mb/d in 2026 then decrease to 105 Mb/d in 2040, condensate production from gas wells increases from 226 Mb/d in 2017 to 435 Mb/d in 2040, and C5+ production from refineries increases from zero in 2017 to 12 Mb/d in 2018 to 28 Mb/d in 2040. Net imports of C5+ in the Technology Case increase from 226 Mb/d in 2017 to 377 Mb/d in 2029 then down to 314 Mb/d in 2040. Total supply is equal to total disposition and is projected to increase from 556 Mb/d in 2017 to 882 Mb/d in 2040 in the Technology Case.
Chapter 4 – Considerations
- This analysis assumes that, over the long term, all energy production will find markets and infrastructure will be built as needed, including processing capacity. However, a lack of markets for Canadian NGL production could lower prices and impact gas production and NGL production trends.
- These projections describe what is possible today given price, economics, technology, geology, and other assumptions. Actual natural gas and NGL production could be different given other unforeseen factors like supply and demand changes, weather, natural gas processing plant outages, etc. Should technology or development costs advance differently than assumed, natural gas and NGL production would be different than modelled here.
- The petrochemical industry’s demand of NGLs is significant. Expansions or contractions in the petrochemical industry could change the production of NGLs and also change the focus on types of natural gas developed,Footnote 18 and hence NGL production.
- Condensate production depends on diluent demand. If oil sands strategies change, including upgrading more bitumen instead of blending it, demand and production of condensate would be affected.
- Supply and demand of crude oil, natural gas, and NGLs are all linked to one another, and a change in supply or demand for one can affect the others.
Appendix
Appendix A – Method (Detailed Description)
This Appendix includes a description of the methods and assumptions used to project natural gas liquids production in EF2018, and discussions on other supplies and dispositions of NGLs in Canada. NGLs are predominantly produced by processing natural gas from the Western Canada Sedimentary Basin (WCSB), but some are also produced as a by-product of oil refining or bitumen upgrading. Raw natural gas at a wellhead is comprised primarily of methane, but often contains other hydrocarbons and some contaminants. These other hydrocarbons may include ethane, propane, butane, pentanes and heavier hydrocarbons, some of which are produced as condensate. The bulk of this appendix explains the methods used to derive NGL production from gas processing.
A1 Domestic NGL Production
A1.1 NGL Production from WCSB Natural Gas Production
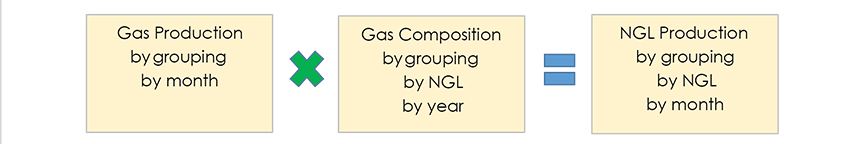
Figure A1.1 summarizes the main method for estimating NGL production from gas processing. Historical and projected gas production comes from the EF2018 gas production analysis. Gas compositions are the amounts of hydrocarbons and contaminants in natural gas at a wellhead. Compositions vary depending on where and what type of natural gas resource is produced. Multiplying the amount of natural gas with its composition equals the volume of each NGL component in the gas.
Figure A1.1 - WCSB Major Gas Production Categories
A1.1.1 Groupings
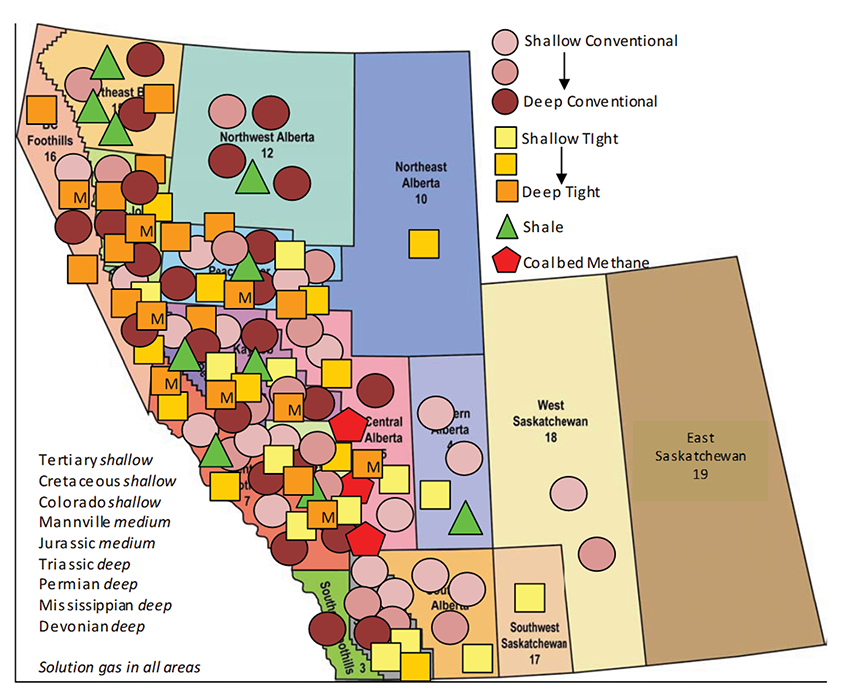
Conventional, tight, shale, coalbed methane, and solution gas resources are grouped geographically on the basis of the Petrocube areasFootnote 19 in Alberta (AB), British Columbia (B.C.), and Saskatchewan, and by geological zone, as shown in Figure A1.2. In this analysis, gas production from the Montney Formation is separate from the other tight gas sources, and is shown in Figure A1.2 by orange squares marked with an ‘M’. In total, western Canada has about 150 gas resource groupings, each with its own set of monthly production and annual gas compositions.
Figure A1.2 – Western Canada Area and Grouping Map
A1.1.2 Gas Compositions
Compositions for each grouping are calculated by well year. In other words, wells in a stratigraphic grouping in a Petrocube area are also grouped by year and each stratigraphic-area-year grouping has its own gas composition. These gas compositions are production-weighted averages of gas analysis data for wells in each stratigraphic-area-year grouping.
Figure A1.3 shows an example of the calculations and assumptions used to go from molar compositions (from the gas-analysis data) to NGL production per marketable natural gas production (barrels per million cubic feet, or b/MMcf). Gas plant recovery factors, by year, determine how much of the NGLs in the gas are produced, because not all NGLs can be recovered. Further details on gas plant recovery factors are in sections A1.1.4 through A1.1.7. Annual NGL ratios by grouping are in appendices B.1 through B.5.
Ethane, propane, butane, and pentanes plus are processed in plants. Liquid condensate (condensate) is recovered at the wellhead and is not produced from all wells, or from all areas. Table A1.1 lists the condensate ratios for particular areas and types of gas. Note that the ratios apply to Montney tight groupings, Duvernay shale groupings, and both the conventional and tight Cretaceous groupings in the listed areas.
Figure A1.3 Molar Compositions and NGL Production Example
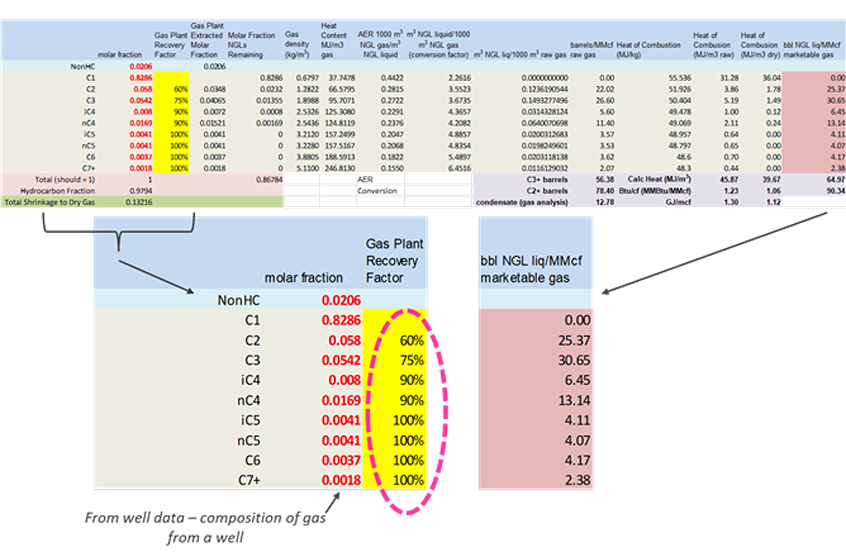
Table A1.1 Condensate Ratios at the Wellhead
A1.1.3 Modelled Production versus Provincial Reported Production
Alberta and B.C. provincial governments report NGL production in each of their respective provinces on their external websites.Footnote 20 Reported volumes are NGLs processed in the gas plants/straddle plants/fractionators located in each of the provinces. NEB-modeled NGL production is based on gas production from each grouping. Thus, NEB-modeled NGL production by province is based on where the natural gas production occurs instead of where the natural gas is processed. Since some natural gas production in B.C. flows to Alberta and is processed in Alberta, there are differences between provincial estimates of NGL production and NEB-modeled NGL production.Footnote 21 However total, modeled NGL production is intended to equal total, provincial reported production.
For each NGL for each historical month:
B.C.NEB + ABNEB = B.C.B.C.gov + ABAER + ONestimate
A1.1.4 Ethane Potential and Production
The majority of ethane is extracted at large gas-processing facilities located on major natural gas pipelines in Alberta and B.C. Since demand for ethane depends on the capacity of petrochemical facilities in Alberta and Ontario using it as a feedstock, and because some ethane is imported from the U.S. by pipeline, not all potentially recoverable ethane becomes production. Ethane surplus to demand is reinjected back into the gas stream. Ethane production plus ethane not recovered is called ethane potential. Ethane potential is calculated by multiplying the gas composition of ethane by natural gas production and a recovery factor, as described in section A1.1.2.
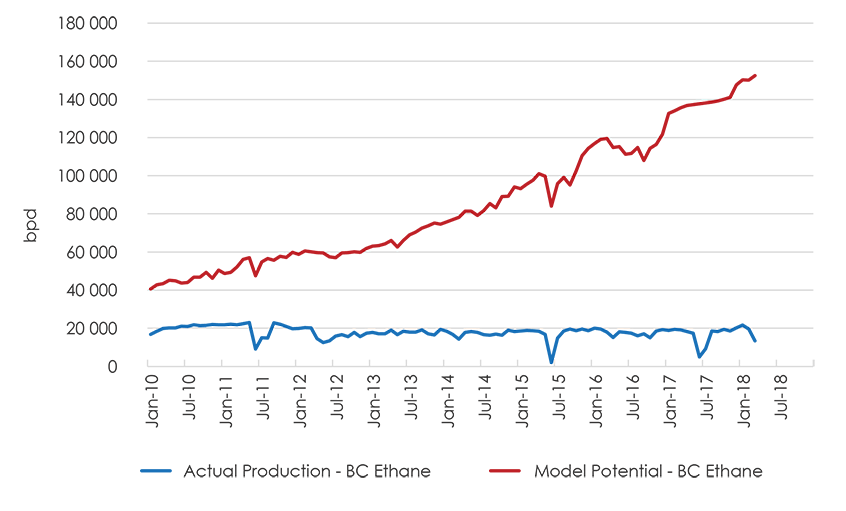
Modeled ethane potential in B.C. is much larger than reported ethane production, as expected. Reported production is ethane production from processing facilities in B.C., and thus does not include the ethane that is not recovered and ethane in gas that flows to processing facilities in Alberta, where some of the ethane is then recovered (see section A1.1.13).
Figure A1.4 B.C. Ethane Potential
Modelled ethane potential in Alberta is different than actual production as reported by AER, even though the lines are coincidentally close, as can be seen in Figure A1.5. Modelled potential includes ethane production and ethane not recovered. AER reported production includes ethane processed in Alberta from natural gas produced in B.C., and does not include ethane not recovered. To compare actual and modelled production for western Canada – to see if the model is calculating historical ethane potential and production accurately – B.C. and Alberta numbers are summed together.
Figure A1.5 Alberta Ethane Potential
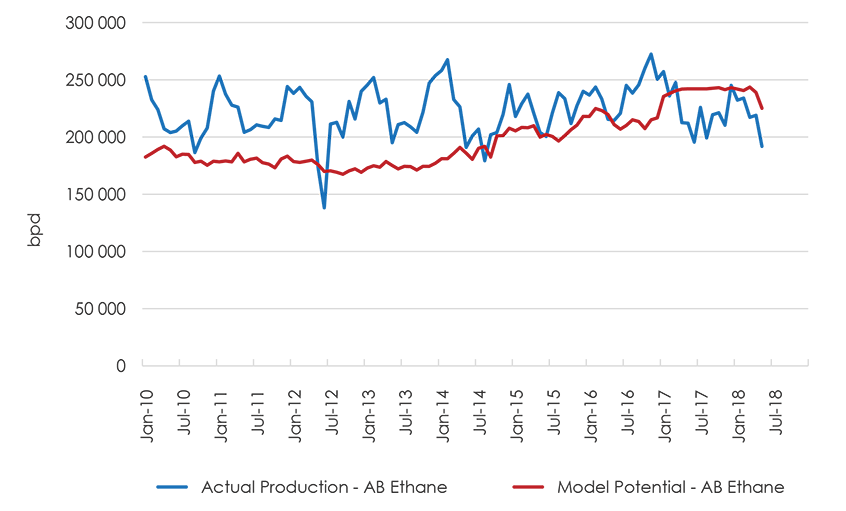
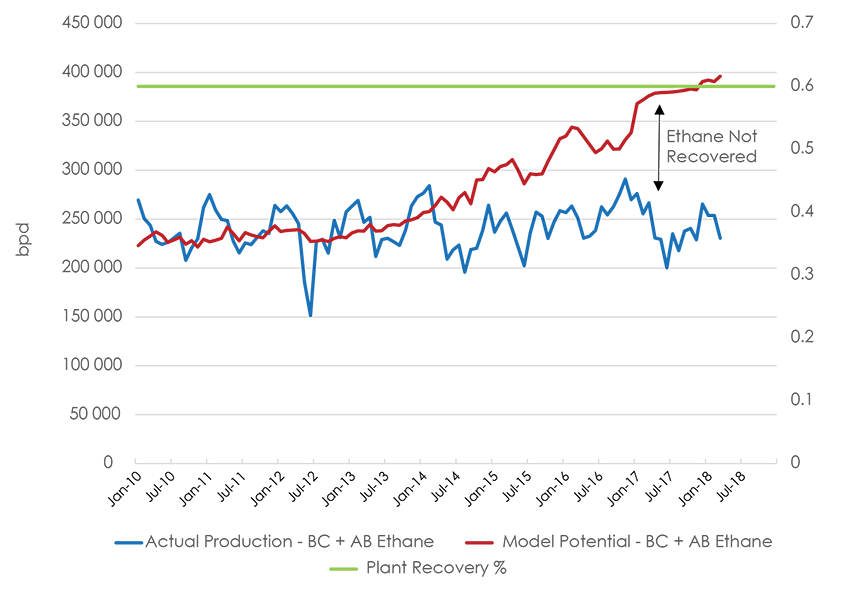
From 2010 to 2013, actual and modeled volumes are close assuming a 60% recovery factor – that is, 60% of the ethane in natural gas production could be recovered from processing facilities. In 2014 and after, however, ethane potential and ethane production diverge. Assuming gas plants are still able to recover 60% of the ethane in raw gas, the amount not recovered has grown since 2014, which was also when ethane imports into western Canada from the U.S. began.
Before 2014 the modelled potential was very close to the actual production reported. There are some large variances between the two for some months, but this is expected given modeled production is based on fairly smooth natural gas production volumes, and actual ethane production can vary more dramatically from month–to–month given plant shutdowns, etc.
Figure A1.6 Alberta + B.C. Ethane Potential
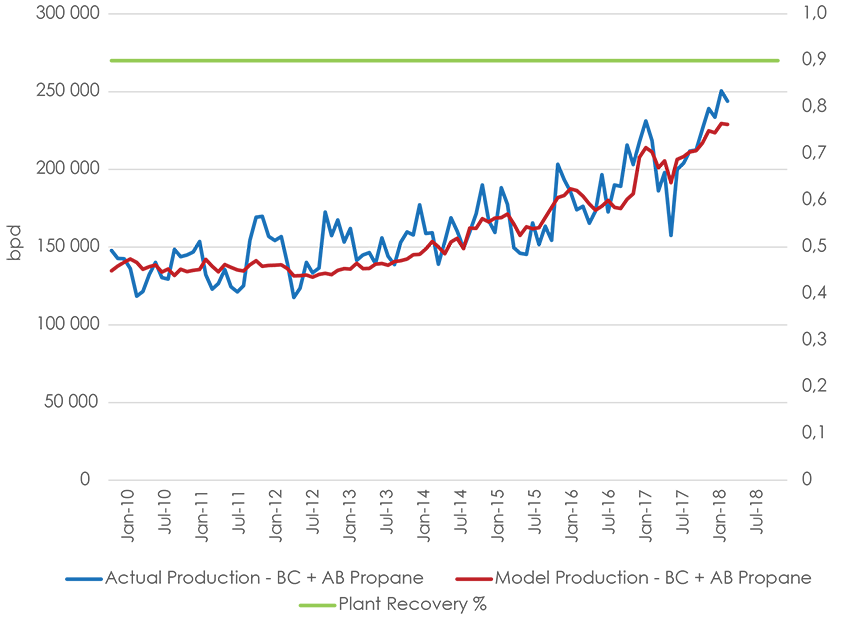
A1.1.5 Propane Production
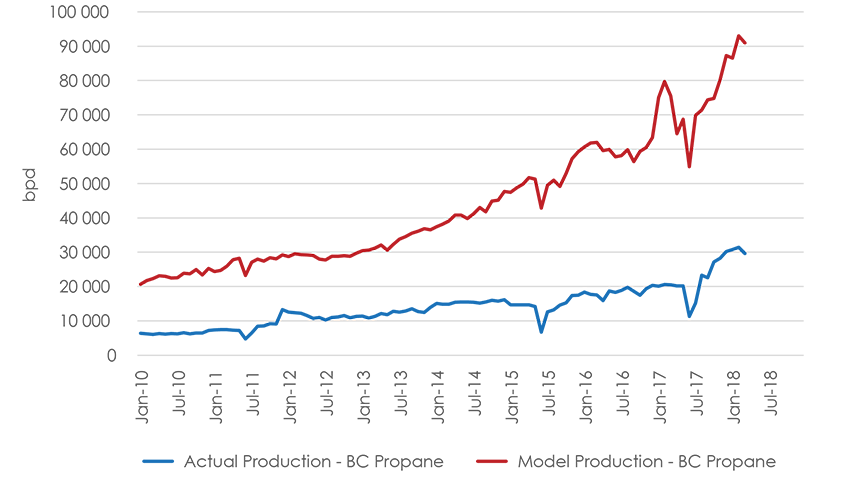
Propane is extracted at gas-processing facilities located in Alberta, B.C., and Ontario, and is also a byproduct of refineries and oil sands upgrading. Figure A1.7 shows that modeled propane production in B.C. is larger than reported propane production, as expected. Reported production is propane production from processing facilities in B.C. Some natural gas produced in B.C. flows to processing facilities in Alberta, where the propane is produced (see section A1.1.13).
Figure A1.7 B.C. Propane Production
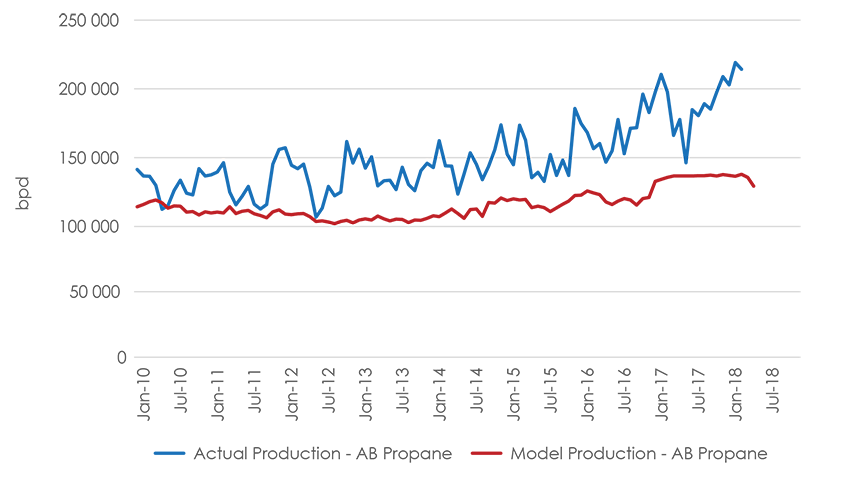
Modelled propane production in Alberta is lower than the AER’s reported production (Figure A1.8). AER reported production includes propane processed in Alberta from natural gas produced in B.C. Alberta actual production also includes propane processed in Ontario from NGL mixes shipped from Alberta to eastern Canada,Footnote 22 which are included in modelled production for Alberta.
Figure A1.8 Alberta Propane Production
With a 90% recovery factor, actual production and modelled production for western Canada are very similar and the modelled production is a good fit for actual production. Assumed recovery factors and compositions are carried forward over the projection.
Figure A1.9 B.C. + AB Propane Production
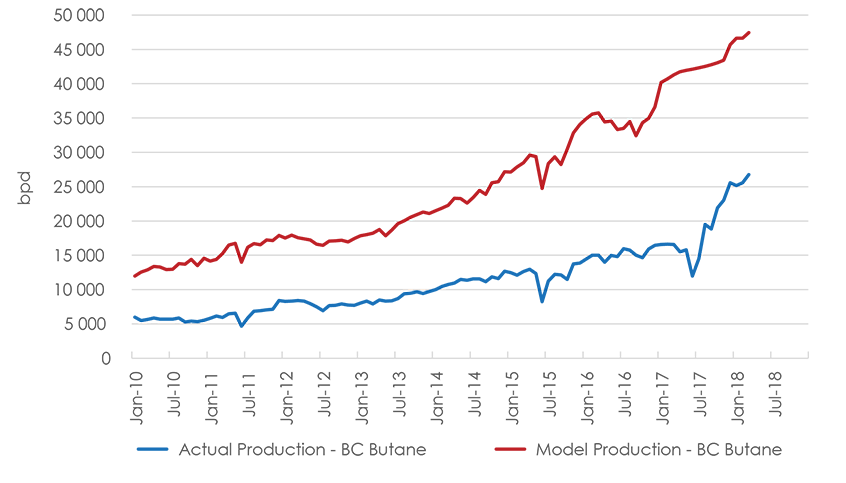
A1.1.6 Butane Production
Butane is extracted at gas-processing facilities located in Alberta, B.C., and Ontario, and is also a byproduct of refineries and oil sands upgrading. Figure A1.10 shows that modeled butane production in B.C. is larger than reported butane production, as expected. Reported production is butane production from processing facilities in B.C. Some natural gas produced in B.C. flows to processing facilities in Alberta, where the butane is produced, and is not included in the B.C. government estimates (see section A1.1.13).
Figure A1.10 B.C. Butane Production
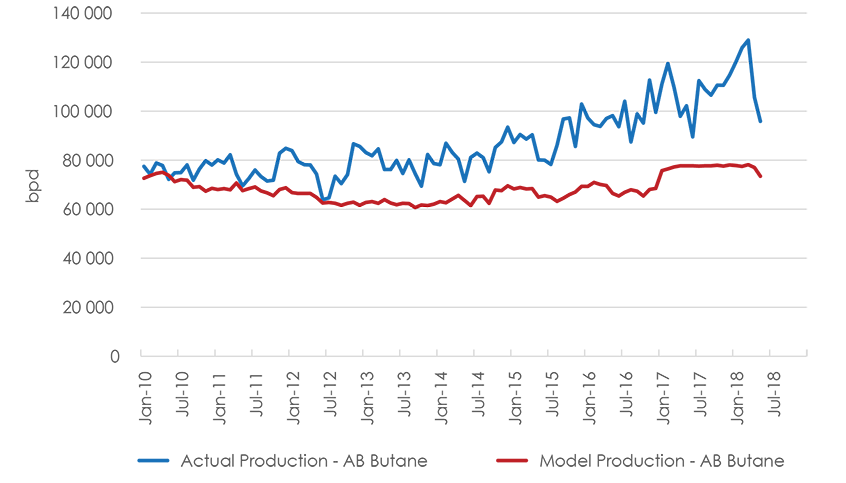
Modelled butane production in Alberta is lower than AER reported production (Figure A1.11). AER actual production includes butane processed in Alberta from natural gas produced in B.C. Alberta actual production also includes butane processed in Ontario from NGL mixes produced in western Canada,Footnote 23 which are included in the modeled production for Alberta.
Figure A1.11 Alberta Butane Production
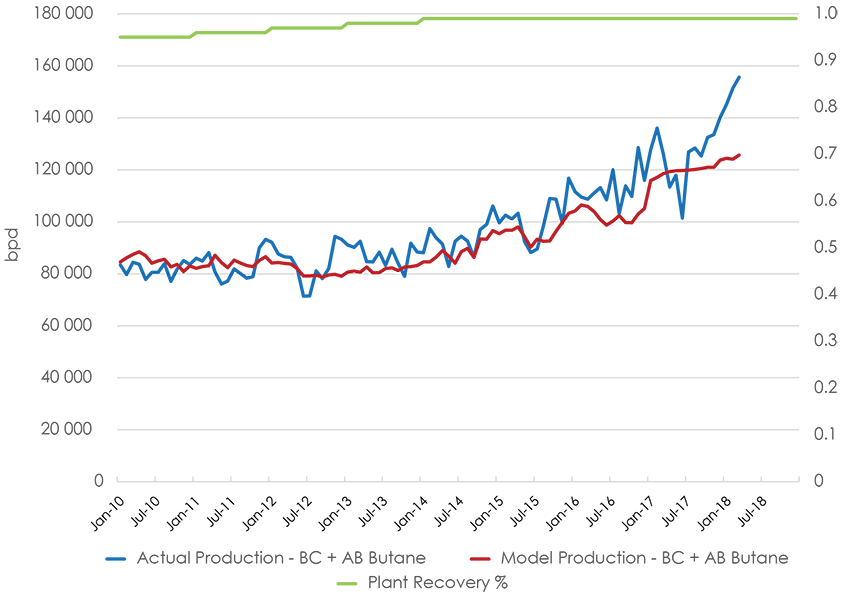
With a 95%–99% recovery factor, actual production and modelled production for western Canada are very similar. The assumed recovery factors and compositions are carried forward over the projection.
Figure A1.12 B.C. + Alberta Butane Production
A1.1.7 Pentanes Plus and Condensate Production
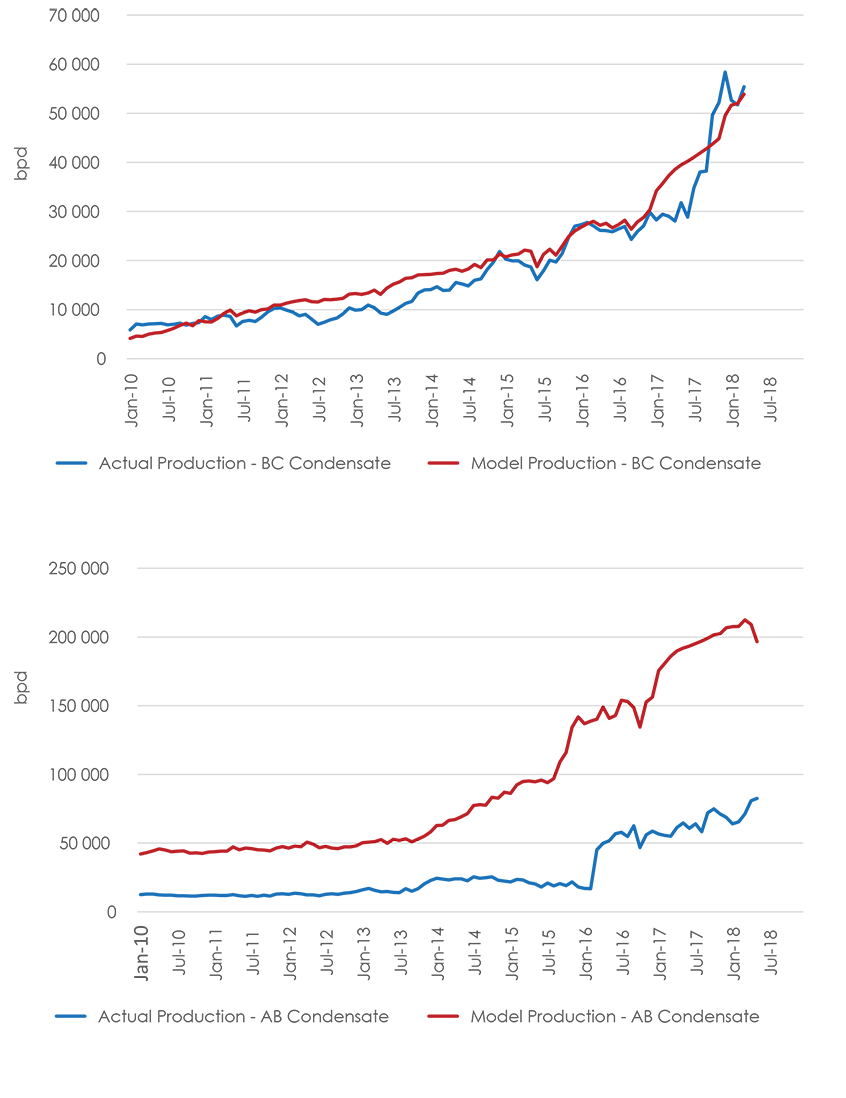
The majority of condensate production comes from gas production at wellheads. Pentanes plus production comes from processing natural gas produced in B.C. and Alberta, and as a by–product from refineries. Differences in actual production and modelled production for each province will occur, because some of B.C.’s natural gas production is processed in Alberta, but also because different government agencies define pentanes plus and condensate differently. Figures A1.13 and A1.14 show modelled production for B.C. is very close to actual production, even with a sharp rise in production over the last two years. The B.C. government categorizes pentanes plus and condensate similar to how the NEB model categorizes them. Further, unlike for ethane, propane, and butane, condensate volumes in B.C. are from condensate production at wellheads, which means it has not flowed into Alberta to be processed and reported there. Alberta has large differences between actual and modelled production for both pentanes plus and condensate. This is especially true over the last five years, when liquids–rich tight gas plays such as the Montney Formation and condensate–rich Duvernay shale gas have increased NGL production. The AER and NEB categorize pentanes plus and condensate differently, and increased condensate production at wellheads in the Montney Formation and Duvernay Shale leads to the large differences: a significant amount of Alberta condensate production is included in the AER’s reported pentanes plus production, whereas modelled production categorizes it all as condensate.
Figure A1.13 B.C. and Alberta Pentanes Plus Production
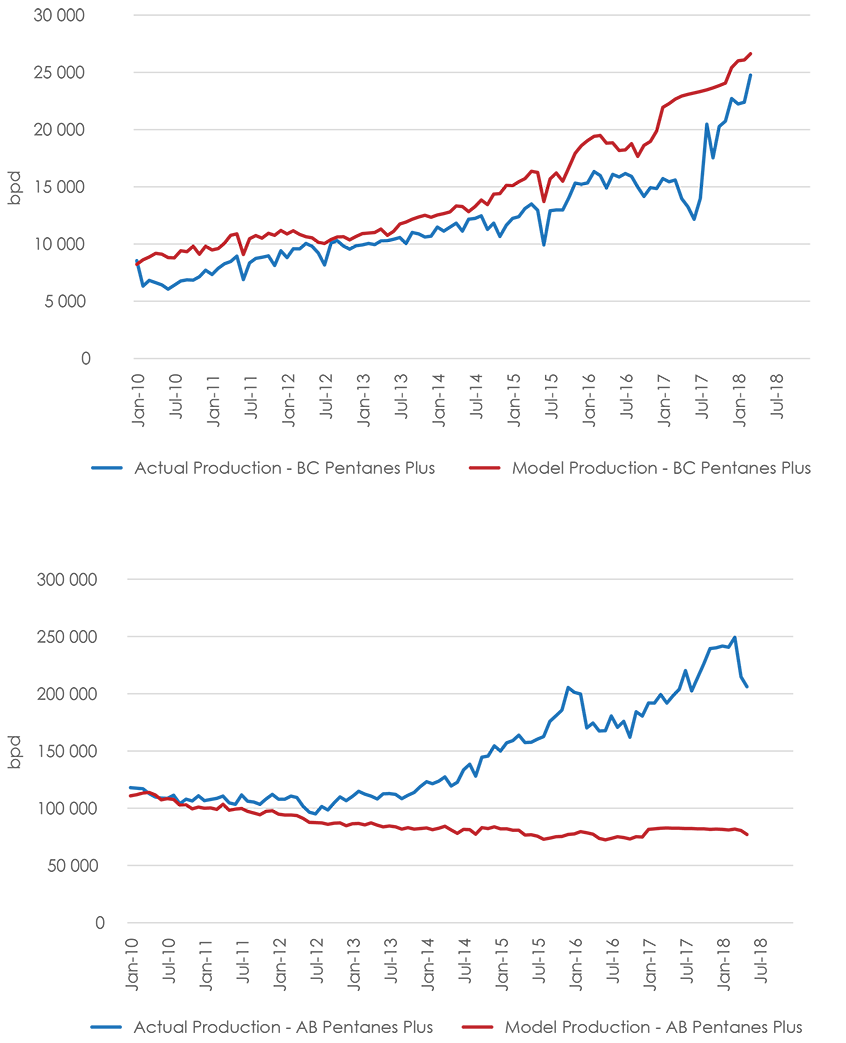
Figure A1.14 B.C. and Alberta Condensate Production
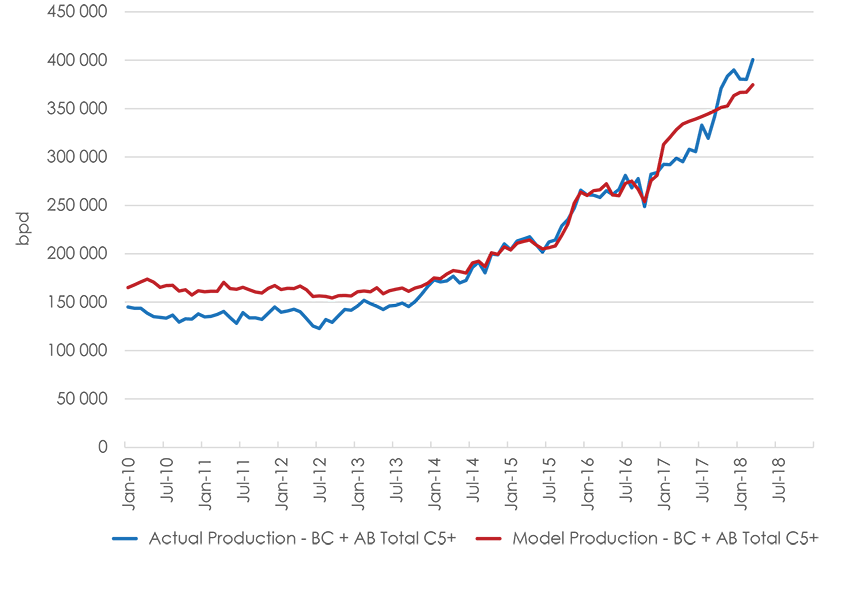
Summing pentanes plus and condensate production for each province shows a much closer match between actual and modelled production (Figure A1.15). Further, since pentanes plus is mostly processed in the province where the gas is produced, or as condensate at wellheads, provincial, reported production doesn’t have to be summed together to compare modeled production. Figure A1.15 shows actual and modelled for each province, and Figure A1.16 shows B.C. and Alberta combined. Both Alberta and B.C. show close fits for modeled and reported production. Assumed compositions and a recovery factor of 100% for both pentanes plus and condensate are carried forward over the projection.
Figure A1.15 B.C. and Alberta Pentanes Plus + Condensate Production
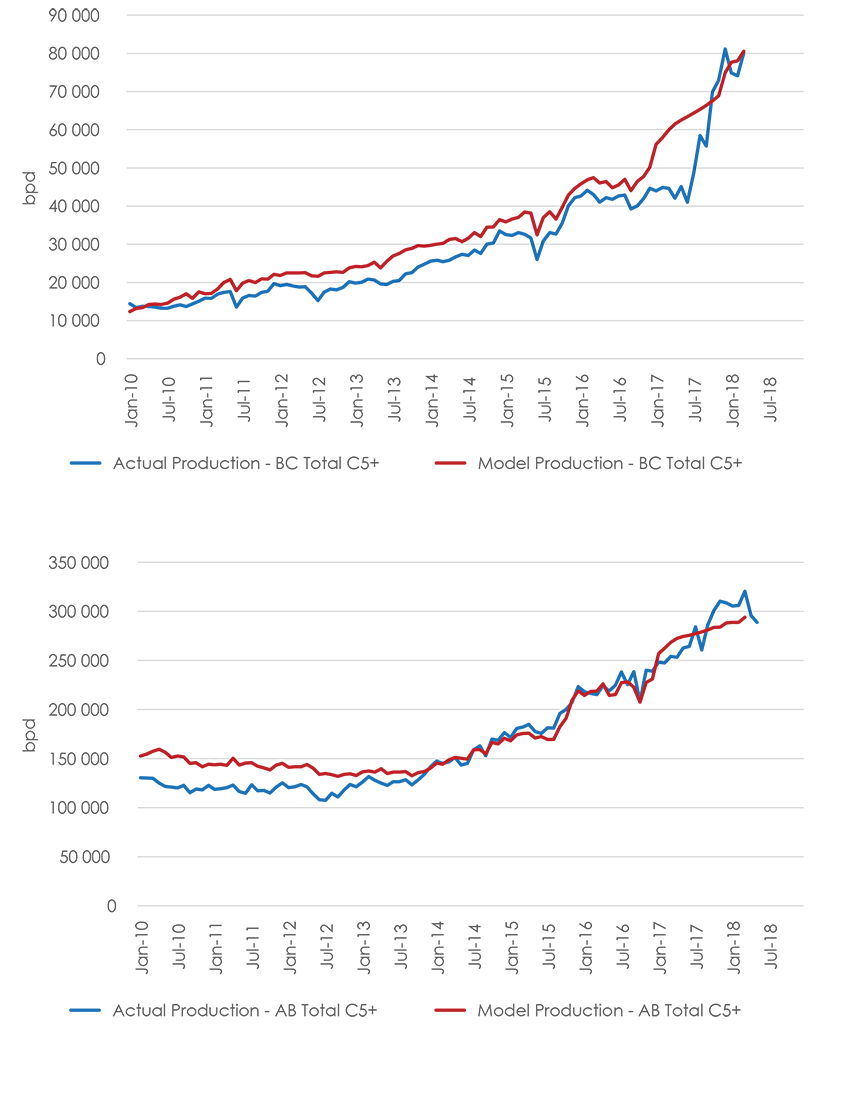
Figure A1.16 B.C. + Alberta Pentanes Plus + Condensate Production
A1.2 Other NGL Production
Most NGL production in Canada comes from processing natural gas from B.C. and Alberta. EF2018 also includes the other sources of NGLs.
Upgrading bitumen produces ethane, propane, and butane as by–products. Projected NGL production from upgrading is based on oil sands upgrading assumptions in EF2018, while historical production is based on ratios of NGL production and upgrading volumes. Propane, butane, and pentanes plus are also produced as a by-product from refining, and are often referred to as Liquefied Petroleum Gas (LPG). Propane and butane production from Canadian refineries has declined over the last decade, and will continue to slowly decline over the projection. Propane and butane production from Alberta refineries will increase in 2018 with the startup of the Sturgeon Refinery, and then stay level over the projection, as demand for refined products, which drives refinery production, is projected to remain constant. Pentanes plus production from refineries is expected to stay level over the projection. A small amount of pentanes plus production has and will continue to be estimated for Saskatchewan.
A small amount of pentanes plus production also occurs in Nova Scotia from its offshore gas production facilities. Both Sable and Deep Panuke are assumed to cease production by the end of 2020, and so too does their pentanes plus production.
A2 Domestic NGL Supply and Disposition
Historical levels and projections of NGL supply and dispositions are discussed in detail in the NGL supplemental report. Appendix A2 briefly summarizes the supply and disposition assumptions.
A2.1 Supply = Production + Imports
Production of each NGL was discussed in Appendix A1. Besides domestic production, other source of NGL supply are imports. Projected imports of ethane from the U.S. are based on Canadian petrochemical demand. Imports of propane from the U.S. into Alberta and Ontario are minimal and held constant at 2017 levels over the projection. Imports of butane into Alberta from the U.S. are minimal and held constant at the 2017 level. Imports of pentanes plus and condensate are based on diluent demand, and are discussed in section A2.3.
A2.2 Disposition = Demand + Exports
Projections of domestic demand of NGL are based on EF2018 demand analysis, which includes factors like GDP growth, population growth, industrial use, end-use technology changes, and others, as discussed in detail in the EF2018 report. Historical exports of NGLFootnote 24 are found on the NEB website. Projected exports of NGL are based on balancing supply and disposition, and are discussed in section A2.3.
A2.3 Supply and Disposition Balance
Historical supply and disposition by year for each NGL are fairly close. The differences are called adjustments. For the projection period, however, exports and/or imports are adjusted so that total supply equals total disposition for each year for propane, butane, and pentanes plus and condensate. For propane, exports are adjusted. For butane, exports are adjusted. For pentanes plus and condensate, the difference between production and demand for a year is either a net export if production is larger than demand or a net import if demand is larger than production.
Ethane balancing is different. Since it is assumed there are no exports, and imports of ethane are based on petrochemical demand for ethane projections, the amount of ethane not recovered is adjusted so that supply and disposition balance each year of the projection.
Appendix B – Groupings Information
Table B.1 – Formation Index
| Formation | Abbreviation | Group Number |
|---|---|---|
| Tertiary | Tert | 02 |
| Upper Cretaceous | UprCret | 03 |
| Upper Colorado | UprCol | 04 |
| Colorado | Colr | 05 |
| Upper Mannville | UprMnvl | 06 |
| Middle Mannville | MdlMnvl | 07 |
| Lower Mannville | LwrMnvl | 08 |
| Mannville | Mnvl | 06;07;08 |
| Jurassic | Jur | 09 |
| Upper Triassic | UprTri | 10 |
| Lower Triassic | LwrTri | 11 |
| Triassic | Tri | 10;11 |
| Permian | Perm | 12 |
| Mississippian | Miss | 13 |
| Upper Devonian | UprDvn | 14 |
| Middle Devonian | MdlDvn | 15 |
| Lower Devonian | LwrDvn | 16 |
| Horseshoe Canyon | HSC | - |
| Mannville CBM | Mannville | - |
Table B.2 – Grouping Index
| Area Name | Area Number | Resource Type | Resource Group |
|---|---|---|---|
| CBM Area | 00 | CBM | Main HSC |
| CBM Area | 00 | CBM | Mannville |
| Southern Alberta | 01 | Conventional | Tert;UprCret;UprColr |
| Southern Alberta | 01 | Conventional | Colr |
| Southern Alberta | 01 | Conventional | Mnvl |
| Southern Alberta | 01 | Tight | UprColr |
| Southwest Alberta | 02 | Conventional | Tert;UprCret;UprColr |
| Southwest Alberta | 02 | Conventional | Colr |
| Southwest Alberta | 02 | Conventional | MdlMnvl;LwrMnvl |
| Southwest Alberta | 02 | Conventional | Jur;Miss |
| Southwest Alberta | 02 | Conventional | UprDvn |
| Southwest Alberta | 02 | Tight | UprColr |
| Southwest Alberta | 02 | Tight | Colr |
| Southwest Alberta | 02 | Tight | LwrMnvl |
| Southern Foothills | 03 | Conventional | Miss;UprDvn |
| Eastern Alberta | 04 | Conventional | UprCret;UprColr |
| Eastern Alberta | 04 | Conventional | Colr;Mnvl |
| Eastern Alberta | 04 | Tight | UprColr |
| Eastern Alberta | 04 | Shale | Duvernay |
| Central Alberta | 05 | Conventional | Tert;UprCret |
| Central Alberta | 05 | Conventional | Colr |
| Central Alberta | 05 | Conventional | Mnvl |
| Central Alberta | 05 | Conventional | Miss;UprDvn |
| Central Alberta | 05 | Tight | Colr |
| Central Alberta | 05 | Tight | Mvl |
| Central Alberta | 05 | Tight | Montney |
| Central Alberta | 05 | Shale | Duvernay |
| West Central Alberta | 06 | Conventional | Tert |
| West Central Alberta | 06 | Conventional | UprCret;UprColr |
| West Central Alberta | 06 | Conventional | Mnvl |
| West Central Alberta | 06 | Conventional | LwrMnvl; Jur |
| West Central Alberta | 06 | Conventional | Miss |
| West Central Alberta | 06 | Conventional | UprDvn |
| West Central Alberta | 06 | Tight | Colr |
| West Central Alberta | 06 | Tight | Mnvl |
| West Central Alberta | 06 | Tight | Montney |
| West Central Alberta | 06 | Shale | Duvernay |
| Central Foothills | 07 | Conventional | UprColr |
| Central Foothills | 07 | Conventional | Colr;Mnvl |
| Central Foothills | 07 | Conventional | Jur;Tri;Perm |
| Central Foothills | 07 | Conventional | Miss |
| Central Foothills | 07 | Conventional | UprDvn;MdlDvn |
| Central Foothills | 07 | Tight | UprColr;Colr |
| Central Foothills | 07 | Tight | Mnvl |
| Central Foothills | 07 | Tight | Jur |
| Central Foothills | 07 | Tight | Montney |
| Central Foothills | 07 | Shale | Duvernay |
| Kaybob | 08 | Conventional | UprColr;Colr |
| Kaybob | 08 | Conventional | Mnvl;Jur |
| Kaybob | 08 | Conventional | Tri |
| Kaybob | 08 | Conventional | UprDvn |
| Kaybob | 08 | Tight | Colr;Mnvl |
| Kaybob | 08 | Tight | Tri |
| Kaybob | 08 | Tight | Montney |
| Kaybob | 08 | Shale | Duvernay |
| Alberta Deep Basin | 09 | Conventional | UprCret |
| Alberta Deep Basin | 09 | Conventional | UprColr |
| Alberta Deep Basin | 09 | Conventional | Mnvl;Jur |
| Alberta Deep Basin | 09 | Conventional | Tri |
| Alberta Deep Basin | 09 | Conventional | UprDvn |
| Alberta Deep Basin | 09 | Tight | UprColr |
| Alberta Deep Basin | 09 | Tight | Colr |
| Alberta Deep Basin | 09 | Tight | Mnvl;Jur |
| Alberta Deep Basin | 09 | Tight | Tri |
| Alberta Deep Basin | 09 | Tight | Montney |
| Alberta Deep Basin | 09 | Shale | Duvernay |
| Northeast Alberta | 10 | Conventional | Mnvl;UprDvn |
| Peace River | 11 | Conventional | UprColr |
| Peace River | 11 | Conventional | Colr;UprMnvl |
| Peace River | 11 | Conventional | MdlMnvl;LwrMnvl |
| Peace River | 11 | Conventional | UprTri |
| Peace River | 11 | Conventional | LwrTri |
| Peace River | 11 | Conventional | Miss |
| Peace River | 11 | Conventional | UprDvn;MdlDvn |
| Peace River | 11 | Tight | UprColr |
| Peace River | 11 | Tight | MdlMnvl;LwrMnvl |
| Peace River | 11 | Tight | UprTri |
| Peace River | 11 | Tight | LwrTri |
| Peace River | 11 | Tight | Tri |
| Peace River | 11 | Tight | Miss |
| Peace River | 11 | Tight | Montney |
| Peace River | 11 | Shale | Duvernay |
| Northwest Alberta | 12 | Conventional | Mnvl |
| Northwest Alberta | 12 | Conventional | Miss |
| Northwest Alberta | 12 | Conventional | UprDvn |
| Northwest Alberta | 12 | Conventional | MdlDvn |
| Northwest Alberta | 12 | Shale | Duvernay |
| BC Deep Basin | 13 | Conventional | Colr |
| BC Deep Basin | 13 | Conventional | LwrTri |
| BC Deep Basin | 13 | Tight | Colr |
| BC Deep Basin | 13 | Tight | Mnvl |
| BC Deep Basin | 13 | Tight | LwrTri |
| BC Deep Basin | 13 | Tight | Montney |
| Fort St. John | 14 | Conventional | Mnvl |
| Fort St. John | 14 | Conventional | Tri |
| Fort St. John | 14 | Conventional | Perm;Miss |
| Fort St. John | 14 | Conventional | UprDvn;MdlDvn |
| Fort St. John | 14 | Tight | Mnvl |
| Fort St. John | 14 | Tight | Tri |
| Fort St. John | 14 | Tight | Perm;Miss |
| Fort St. John | 14 | Tight | Dvn |
| Fort St. John | 14 | Tight | Montney |
| Northeast BC | 15 | Conventional | LwrMnvl |
| Northeast BC | 15 | Conventional | Perm;Miss |
| Northeast BC | 15 | Conventional | UprDvn;MdlDvn |
| Northeast BC | 15 | Tight | UprDvn |
| Northeast BC | 15 | Shale | Cordova |
| Northeast BC | 15 | Shale | Horn River |
| Northeast BC | 15 | Shale | Liard |
| BC Foothills | 16 | Conventional | Colr;Mnvl |
| BC Foothills | 16 | Conventional | Tri;Perm;Miss |
| BC Foothills | 16 | Tight | LwrTri |
| BC Foothills | 16 | Tight | Tri |
| BC Foothills | 16 | Tight | Montney |
| Southwest Saskatchewan | 17 | Tight | UprColr |
| West Saskatchewan | 18 | Conventional | Colr |
| West Saskatchewan | 18 | Conventional | MdlMnvl;LwrMnvl;Miss |
| East Saskatchewan | 19 | Conventional | Solution Gas |
See the Excel Appendix file [EXCEL 13170 KB] for all charts and tables in this Appendix, and for Appendices B and C – which include details on NGL contents by grouping, and monthly NGL production by grouping.
- Date modified: