ARCHIVED - Canada's Energy Future - Reference Case and Scenarios to 2030 - Energy Market Assessment
This page has been archived on the Web
Information identified as archived is provided for reference, research or recordkeeping purposes. It is not subject to the Government of Canada Web Standards and has not been altered or updated since it was archived. Please contact us to request a format other than those available.
Chapter 5: Triple E
Triple E refers to balancing of economic, environmental and energy (triple E) objectives. This scenario is characterized by well-functioning energy markets, cooperative international agreements and the most rigorous energy demand management policies of the three scenarios.
Scenario Overview (2005-2030)
Global Forces
At the beginning of this scenario, geopolitical tensions are easing. High energy prices constrain demand as the developing world maintains rapid economic growth rates. These high energy prices lead to:
- increased international investment in previously marginal energy plays and in energy infrastructure;
- development of alternative sources of energy supply;
- slowing of international energy demand growth rates as consumers search for more efficient methods of using energy and governments introduce policies to manage demand;
- increased international co-operation to increase access to global supplies and coordinate demand; and
- continued support to deal with rising emissions levels.
By 2010, the ingredients for a low price environment are established. The combination of increased access to energy supplies and a moderation of energy demand growth leads to an energy market with some slack. As a result, energy prices fall between 2010 and 2020.
Environmental action becomes a worldwide phenomenon. The environmental movement has continued to gain momentum in the developed world and is now seen as a key policy-making consideration. Higher incomes in the developing world lead to increased demand for environmental stewardship. Despite falling global energy prices, the comprehensive energy demand and emission management policies that were introduced to combat high energy prices at the beginning of the scenario are expanded rather than abandoned.
By 2030, the gross domestic products of global economies experience significant growth and as a result, global energy demand also grows. However, energy demand has not grown as quickly as it might have in the absence of government policies and social value changes. Although not necessarily there yet, the world is on the path to achieving more sustainable growth. The link between energy demand, emissions and economic growth is weakening.
There continues to be sufficient global energy supplies to meet energy demand requirements and as a result, world energy prices remain low. The most notable achievements include increased access to global energy resources as geopolitical tensions continue to improve, the development of a large-scale liquefied natural gas (LNG) market and significant growth in global alternative and emerging energy resources. Lastly, the relative share of cleaner energy sources increases as the world places more value on green energy supplies.
Canadian Outcomes
Just as in the global context, the Canadian Triple E energy path is characterized by long-run government policies directed at balancing energy use, environmental impacts and economic growth. The policies considered include[51] the following:
- urban design (e.g., urban density requirements, stricter standards for energy use in residential and commercial building codes, smart metering, support for district energy);
- a price on emissions, which could be achieved through a number of policy programs, such as a carbon dioxide (CO2) tax, a cap and trade system, or others;
- increased energy efficiency standards (e.g., residential and commercial appliances, engines and motors for industrial applications);
- financial incentives (e.g., residential and commercial building retrofit subsidies);
- research, development, and demonstration funding (e.g., subsidies and grants for the development of energy efficient and/or low-emission technologies, including the development of a carbon dioxide pipeline in Alberta and/or Saskatchewan to facilitate CO2 capture and storage);
- information and voluntary programs (investment in programs and policies to make consumers aware of the energy used and environmental impacts of goods and services consumed); and
- transportation sector initiatives, including increased mass transit infrastructure, increased vehicle standards for personal and freight transportation, and renewable vehicle fuel requirements (e.g., ethanol and biodiesel).
[51] It is important to note that this analysis does not include an examination of other impacts associated with the implementation of these programs, such as program cost-effectiveness, distributional impacts, or competitiveness implications. Thus, this suite of programs should not in any way be construed as a recommendation for future policy development, but rather it should be viewed as an exploration of energy efficiency and emission intensity potential within Canada, given the strong societal support inherent in the Triple E Scenario.
Abundant global energy supplies and low world energy prices result in the lowest Canadian oil and gas production outlook. This, in combination with economic-environmental trade-offs, make Triple E the moderate economic growth scenario. As a result of the comprehensive energy demand and emission management policies, this scenario sees demand stabilize and major improvements in energy intensity.
Macroeconomic Outlook
The key factors that shape the macroeconomic outlook in this scenario are well-functioning global markets and progressive energy demand and environmental management programs.
In the Triple E Scenario, population growth slows to 0.8 percent per year, slightly higher than the population growth rate in the Continuing Trends Scenario (Table 5.1). Higher immigration levels are assumed as a result of the more open nature of this scenario. Despite the higher population, labour force growth continues to slow over the outlook period, averaging 0.7 percent per year as a result of demographic trends. Productivity measured as output per employee improves to 1.5 percent per year as a result of strong energy and environmental management programs, which encourages Canadian producers and consumers to invest in more efficient equipment.
Table 5.1
Key Macroeconomic Variables – Triple E 2004-2030
| 1990-2004 | 2004-2030 | |
|---|---|---|
| Population | 1.0 | 0.8 |
| Labour force | 1.3 | 0.7 |
| Productivity | 1.4 | 1.5 |
| Gross domestic product | 2.8 | 2.2 |
| Goods | 2.5 | 2.4 |
| Service | 3.0 | 2.2 |
| Real disposable income | 3.6 | 4.1 |
| Exchange rate (average cents US/Cdn dollar) | 74 | 98 |
| Inflation rate (average %) | 2.3 | 1.8 |
| (Annual Average Growth Rate (% per year) unless otherwise specified). | ||
Population and productivity assumptions result in Canadian gross domestic product (GDP) averaging 2.2 percent per year (Figure 5.1). This is slightly slower than historic GDP growth because increased productivity does not fully compensate for the lower labour force.
Figure 5.1
Real GDP Growth Rates – Triple E 2004-2030
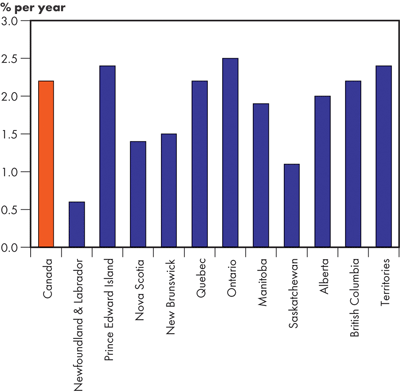
The structure of the Canadian economy remains fairly stable. By 2030, the goods producing sector continues to account for one-third of the GDP and the service sector accounts for two-thirds. However, the regional distribution of Canadian economic growth changes. The manufacturing regions of Canada, specifically Ontario and Quebec, benefit from strong manufacturing export demand. However, the oil and gas producing regions of Canada face low commodity prices, which result in slower production. This is particularly apparent in Alberta where economic growth is actually below the Canadian average.
Energy Prices[52]
Crude Oil Prices
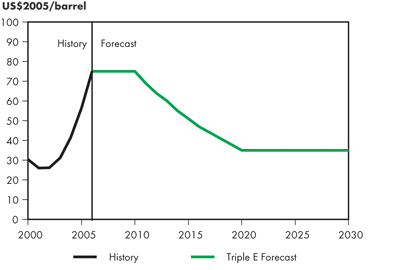
The Triple E Scenario assumes a gradual reduction of the security premium[53] on oil and enhanced access to world oil resources through technology, investment and cooperative international relations (Figure 5.2). Additionally, global government action and consumer value changes ease demand growth around the world. World energy prices follow this trend and by the end of the scenario, are well below levels seen in the Reference Case or in Continuing Trends.
[52] Note in Triple E there is an assumed CO2 price that drives up the delivered fuel prices faced by consumers. The CO2 price is described in detail in this chapter and end-use price data are contained in the appendices. The oil and gas prices presented here are the commodity prices and do not include the CO2 price.
[53]A premium to the oil price reflecting the degree of risk of interruption in oil supply. Geopolitical events that threaten oil supplies result in higher oil prices.
Figure 5.2
West Texas Intermediate Crude Oil Price at Cushing, Oklahoma – Triple E
Natural Gas Prices
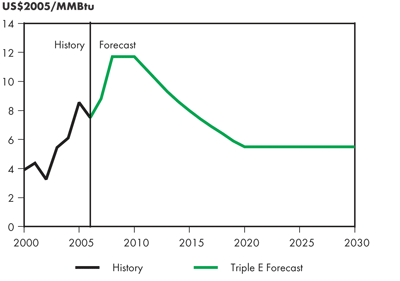
High LNG imports in Triple E have a dampening effect on North American natural gas prices and cause the Henry Hub natural gas price to decline over the period to US$5.25/GJ (US$5.50/MMBtu) (Figure 5.3). As the lowest carbon-content fossil fuel, natural gas commands a premium in this scenario, with a price at 94 percent of the equivalent crude oil price on an energy-equivalent basis.
Figure 5.3
Natural Gas Price at Henry Hub, Louisiana – Triple E
Electricity Prices
Price pressures moderate in Triple E as oil and natural gas prices decline from the levels of the early 2000s putting downward pressure on the costs for fossil-fired generation. There is also a decline in the growth of new generation, as the growth in electricity demand moderates. These downward pressures are partially offset by an increasing share of higher-cost alternative or emerging technologies in the generation mix (e.g., wind, hydro and clean coal), consistent with an increased emphasis and programs focused on addressing concerns surrounding air quality and greenhouse gas (GHG) emissions[54].
[54] Regional electricity prices are provided in the Appendix 5.
Coal Prices
The world supply and demand balance is not entirely different from the Continuing Trends Scenario; thus, the commodity price of coal is the same. However, the carbon intensity and corresponding cost reduces its price advantage compared to natural gas. As a result, coal purchasers, including coal-fired power generators and industrial end users, pay a premium.
CO2 Emission Price and Revenue Recycling
The benefit of pricing emissions is that it more accurately captures the full cost of energy production and use. There are a number of different programs and policies that could be implemented to create a price for CO2 emissions, including a CO2 tax or a GHG emissions cap and trade program. Pricing emissions allows for cost-effective emission reductions, incentives for investments in cleaner and more energy efficient technologies, and development of a pool of revenue that can be recycled back into the economy to further support policy objectives.
In the Triple E Scenario a portion of the revenue collected through the CO2 emission price is used to support building retrofit programs, advancement of research, development and demonstration (R,D&D) that facilitates the technological shift assumed in this scenario, capital projects (e.g., support for the development of a backbone CO2 capture and storage pipeline), and information and capacity building. Capacity building includes not only public education campaigns, but also training of qualified engineers, architects, operators and installers. These information programs result in greater energy awareness, higher levels of energy conservation and the development of improved energy systems.
Energy Demand
The key dynamic of Triple E is moderating energy demand in the midst of robust economic activity. Achieving the balance between economic, energy, and environmental ideals in this scenario involves pursuit of a full portfolio of policies, and support of Canadians. The result is demand essentially flattens, as average growth is reduced to 0.3 percent annually. Key influences include energy efficiency and conservation and the shift to less carbon-intensive fuels, such as ethanol and biodiesel[55].
[55] Emerging and alternative energy sources for the production of electricity, such as wind generation, are considered in the Electricity Supply section within this chapter.
Although world energy prices are the lowest in Triple E, the end-use consumer price for fossil fuels is similar to the Continuing Trends Scenario because there is a price for CO2 emissions. The emissions adjustment is based on carbon content of the fuel and is scaled up over time. The cost of CO2 emissions between 2010 and 2014 is $15/tonne[56]. This price increases by $10 every five years. By the end of the outlook period, the CO2 emissions price is $45/tonne of CO2. Revenue collected through the CO2 price is recycled back into the economy to support the structural shift required in the Triple E Scenario.
[56] As an example, this translates into roughly 4 cents per litre of gasoline.
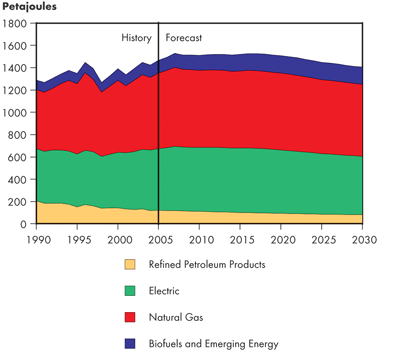
Total Secondary Energy Demand Trends
Canadian total secondary energy demand in the Triple E Scenario grows at a rate of 0.3 percent over the 2004 to 2030 period, significantly lower than the historical growth rate of 1.8 percent from 1990 to 2004. The industrial sector has limited ability to switch to cleaner and cheaper fuels, and as such, demand increases faster than in the more policy-responsive residential and commercial sectors.
Demand sector shares and growth rates vary by province. The three largest energy consumers are Ontario, Alberta and Quebec. Ontario accounts for 33 percent of total secondary energy demand in Canada, Alberta accounts for 26 percent and Quebec 19 percent. Provincial population, personal disposable income and economic activity assumptions, as described in the macroeconomic section of this chapter, all affect provincial energy demand. Total secondary demand growth rates vary by region, with Ontario, Quebec, Alberta, Prince Edward Island, the Yukon and Nunavut all having growth rates higher than the Canadian average. All other provinces, along with the Northwest Territories, show lower demand growth rates. Saskatchewan, Manitoba, Nova Scotia, New Brunswick and Newfoundland and Labrador have negative average annual growth rates over the forecast (i.e., demand in 2030 is lower than it was in 2004). This negative growth rate is a consequence of population trends, moderate economic growth and energy efficiency improvements.
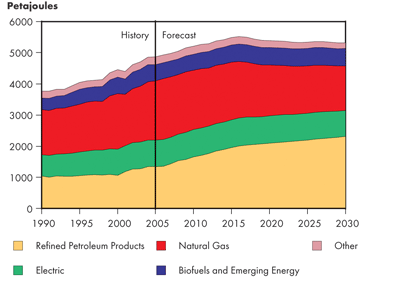
Figure 5.4
Canadian Total Secondary Energy Demand by Fuel – Triple E
('Other' includes coal, coke, coke oven gas, and steam)
The energy demand projection shows initial high growth which slows and eventually flattens (Figure 5.4). A delicate balance is established between economic drivers (income and GDP) putting upward pressure on demand, and the countering influence of programs, policies, and societal values putting downward pressure on energy demand.
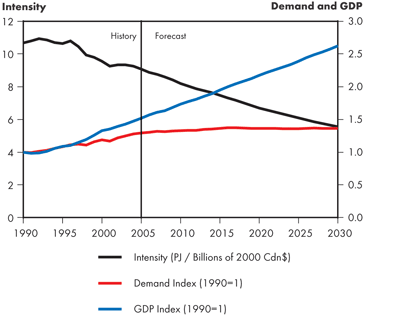
The overall Canadian demand intensity declines fastest in the Triple E Scenario, at 1.9 percent annually, well above the historical annual rate of 1.0 percent (Figure 5.5). This reduction in demand intensity is primarily caused by the assumed aggressive energy policies in this scenario.
Figure 5.5
Canadian Total Secondary Energy Demand Intensity – Triple E
Residential Secondary Energy Demand
The residential sector is particularly responsive to a combination of policies. This assists in overcoming the historical trend of increasing demand due to a 'more and bigger' consumer mindset that essentially cancelled out past energy efficiency gains. Regulations applied uniformly across Canada bring what were formerly marginal technologies and practices into widespread application. As a result, several end-use services, such as space and water heating, see a net decrease in energy demand between 2004 and 2030. Demand reductions in the residential sector are achieved through the integration of several key policies, including the following:
- all new homes meet R-2000[57] (or equivalent) energy performance standards by 2015 (and this rate of improvement is maintained until 2030);
- all new appliances meet Energy Star approval ratings by 2015; and
- introduction of programs and policies to support energy retrofits on existing homes.
[57] An R-2000 Standard home meets technical requirements for new home performance beyond building codes.
Policies for strategic urban planning, or 'smart growth' are emphasized. Policies specific to residential building energy use include:
- more compact urban design, including an increase in multi-density dwellings in relation to single dwellings; and
- shared walls and energy-operating systems between multiple households, including community energy (such as district heating or distributed energy).
The new housing standard in Triple E is a 30 percent improvement in energy performance over the historical average. This improvement has already been demonstrated by such building programs as R-2000, BuiltGreen[58] and Energy Star for Homes. The green building market has been experiencing rapid growth recently. There are indications of unprecedented market support and in this scenario it is assumed that these options are pursued in the majority of new homes that are built.
[58] BuiltGreen is a non-profit organization that promotes environmentally friendly home building methods and practices.
The 30 percent improvement target represents aggregated savings that takes into account building shell (insulation/draft-proofing), windows, heating systems, lighting and appliances. The existing home energy performance rating system in Canada, EnerGuide for Houses (EGH)[59], is a useful indicator of the progression of new homes between 2004 and 2030. In the past few years, new homes had an average EGH rating of around 72. The assumed target for 2015 is a rating of EGH 80 and increases to between EGH 90 to 100 by 2030. To achieve this, a combination of technology and process improvement is applied. As an example, improvements in hot water heating can be gained through technological advancement (i.e., condensing water heater) and process improvements (i.e., low flow showerheads). Process improvements allow for efficiency improvements beyond what is technically possible on the device itself. The savings are extended further by behaviour changes. The Triple E Scenario applies a universal conservation ethos, which significantly enhances even small technology improvements.
[59] A net-zero energy home would be the equivalent of an EnerGuide rating of 100. A rating of EGH 90-100 is considered to include the best in home building technology, appliances and lighting and some contribution from alternative energy.
Large home appliances maintain their historic trend of improvement and have the built-in automation necessary for participation in utility demand response programs, such as peak load reduction and time-of-use rates. Energy Star increases its market penetration and becomes the standard by 2015. The historic trend of increasing electrical demand from an onslaught of small electronics, such as computers, portable devices and entertainment devices, is mitigated by new international laws limiting standby power consumption to 1 watt on all electronics.
Hydrogen’s Role in Canada’s Energy Future
On a per capita basis, Canada is already the largest hydrogen producer within Organization for Economic Cooperation and Development (OECD) countries and is at the forefront of hydrogen research and development. The appeal of the 'hydrogen economy' is tremendous and Canada is well positioned to benefit from its development.
Hydrogen, like electricity, is simply a way of distributing energy. It is closer in character to a battery than a fuel. The production of hydrogen comes at the expense of other energy inputs. Presently, the majority of hydrogen production is produced from natural gas, in a process that releases CO2 into the atmosphere. Alternatively, hydrogen could be generated from electrolysis of water by electricity. This electricity could come from coal, gas or nuclear generation, but the ideal long-term strategy would link renewable energy (hydro, solar, wind) with hydrogen generation. Presently it is less expensive to produce hydrogen from natural gas than electricity. The opportunities for hydrogen depend on the application. The following table lists possible applications for hydrogen along with associated benefits and challenges:
| Application | Main Benefits | Main Challenges |
|---|---|---|
| Replacement for transportation gasoline and diesel | Efficiency improvement, CO2 abatement, improvement in urban air quality | Replacing/adding hydrogen fuelling infrastructure, hydrogen storage, costs |
| Replacement for natural gas in residential and industrial markets | Uninterruptible power units/standby power, combined heat power (CHP) applications, replacement for steam methane reforming in oil sands refining and upgrading | Main markets generally not situated near source of production, adding to expense |
| Storage medium for buffering electrical power | Complementary to intermittent power sources (wind, solar) and ability to take advantage of grid off-peak and reserve capacity | Competing with other, rapidly advancing energy storage technologies |
The difficulties the industry faces are evident by the 20 percent decrease in investment value in the last few years, as reported by the Canadian Hydrogen Association. Despite the very high costs associated with hydrogen production and use today, investment by industry, provincial and federal governments confirms that hydrogen is still very much part of regional energy policies. The widespread deployment and impact of these technologies will likely fall outside of the timeframe of this report, and therefore, are not included.
For further information on hydrogen in Canada, visit the Canadian Hydrogen Association web site.
By the end of the scenario, the incremental advances in efficiency begin to decrease; however, the implementation of the best available technology includes an increasing contribution from alternative and emerging energy. By the end of the Triple E Scenario, many homes and communities are net-zero energy consumers. The contribution from on-site renewables offsets purchased energy.
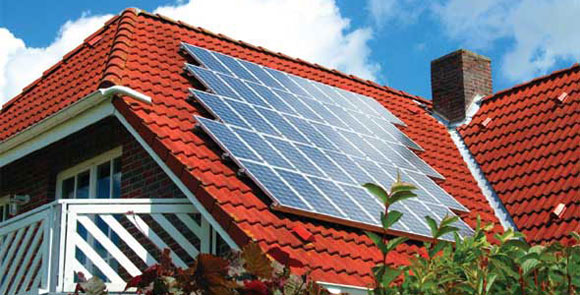
Photovoltaic (solar PV), solar thermal and geothermal are considered as part of the home energy operating systems and as such, are modeled on the demand side. Uptake rates are based on industry association projections. The last few years have seen rapid growth in these technologies, but the curve starts from a negligible base. Achieving full potential in the EGH 90-100 range requires better technology at lower cost. These developments are assumed to occur through proactive investments in research and development.
The residential sector energy performance is limited by the large stock of existing, inefficient older homes that remain in the demand pool for decades. Major retrofits are disruptive and costly and economic benefits occur well after the average length of time people own a home. Until very recently, the official number of home energy retrofits completed under the EGH program has been small (less than 10 000 per year). Further, the leading motivation for home renovations has historically been aesthetics. To address this, Triple E allocates a portion of the revenue collected from the CO2 price toward subsidies for energy retrofits. Approximately 5 percent of the older homes are retrofitted each year for an 18 percent reduction in energy demand. Recent statistics indicate an unprecedented number of homeowners considering home renovations in the near future[60]. The Triple E mindset assumes that any opportunity to renovate automatically includes improvements in energy use. This attitude, along with concern for indoor air quality and an added financial incentive, effectively leverages almost every home renovation project into an energy efficiency upgrade.
[60] Canada Mortgage and Housing Corporation, Canadian Housing Observer, 2005.
Perhaps the policy most indicative of the paradigm shift in Triple E concerns urban form, encompassing energy efficiency, alternative energy, urban design, distributed energy and transportation issues. As well, it reveals the complex challenges between technology and structural (zoning/codes/regulations) issues that need to be addressed. Modeling the policy started with an increased ratio of multi-dwelling (apartment, row or condominium) new home starts compared to single family dwellings. Historically, single starts have outnumbered multi-starts. The last few years have seen a marked increase in multi-starts[61], and this trend is continued and enhanced, leading to multi-dwelling homes accounting for an extra 10 percent of stock within the modeling period.
[61] Canada Mortgage and Housing Corporation, Canadian Housing Observer, 2005
Higher density allows for reduced energy demand in the residential sector, due to shared walls and shared energy systems. It also sets off a cascading series of opportunities. The higher density developments support distributed energy and community energy system opportunities. District heating systems, large geothermal or energy storage systems, and electrical net-metering help extend efficiency ratings well beyond individual end-use devices. Urban form's biggest impact is in transportation, which is covered later in this chapter.
Awareness and education are a large part of the Triple E Scenario. The awareness concept was modeled on the results of smart metering demonstration projects where participants reduced electrical consumption by an average of six percent, in response to availability of information[62]. While the energy saving was predominately applied to electricity in existing home stock, all end-uses received at least a small input from the general concept of awareness and energy conservation characteristic of Triple E.
[62] Energy Evolution, 2006. Ontario Government Approves Full Smart Metering Rollout for Chatham-Kent Hydro. September 14, 2006.
Overall, Canadian residential secondary energy demand decreases at 0.1 percent over the 2004 to 2030 period (Figure 5.6).
Figure 5.6
Canadian Residential Secondary Energy Demand by Fuel – Triple E
Commercial Secondary Energy Demand
The policies, opportunities and results in the commercial sector are very similar to the residential sector. It is appropriate that these two sectors are frequently grouped together simply as the 'built' environment.
The gap between historical and future commercial building performance is addressed through the same combination of policies as in the residential sector. The most important of these policies is a tightening of building codes to raise the level of all new building energy performance to the Leadership in Energy and Environmental Design (LEED®) silver standard, which is a 25 percent improvement in energy performance by 2015. The LEED® rating system is also based on a variety of environment-friendly building technologies. Developers are free to choose the most appropriate of a wide variety of energy efficiency measures (insulation, windows, ventilation, lighting, appliances), building material, resource use (including water) and alternative energy options in order to meet minimum requirements on a project-by-project basis.
A recent surge in construction of exemplary green buildings has taken place[63]. Issues such as corporate branding, indoor air quality (improved productivity/reduced sick-days) and prestige are market forces presently driving the interest. The full impact is obtained through a regulated minimum standard across the country. Energy savings between these buildings and the reference is typically 25 to 50 percent; however, savings of 60 to 80 percent have been achieved[64].
[63] As listed by the Canadian Green Building Council
[64] Based on recommended minimums as stated in Model National Energy Code for Buildings (MNECB)
The probability of significantly improving existing commercial building stock is even more challenging than in the residential market. This is a major issue considering 75 percent of infrastructure in place by 2030 has been built before 2005. A large part of Canada's installed buildings are relatively old[65]. Subsidized retrofit polices have proven effective. Results from the federal Commercial Building Incentive Program (CBIP) show an average improvement of 35 percent over the Model National Energy Code for Buildings (MNECB) after upgrades. In the last few years, improvements of 50 to 60 percent were common[66]. In modeling Triple E, an improvement of 20 percent is applied to 5 percent of the existing building stock each year. There is a pool of easily accessed 'low-hanging fruit' within the commercial building sector due to lighting improvements (fluorescent bulbs, day lighting and occupancy sensors) and improvements in building automation and controls. Although economic in any scenario, in Triple E these better opportunities are leveraged, along with the subsidies, for a more systems-based, whole building approach.
[65] 31 percent are 40 to 80 years old and 28 percent are over 80 years old. The Canadian Society of Civil Engineering. Civil infrastructure systems technology roadmap, 2003-2013. June 2003.
[66] Natural Resources Canada (NRCan) Built Environment Strategic Roadmap - Commercial Buildings Technology Review, CANMET Energy Technology Centre (CETC), 2007.
Urban Form as Smart Growth
Many Canadian cities have adopted the concept of smart growth in order to achieve long-term economic and environmental sustainability. The essence of smart growth is a strategy of land use and urban form which promotes:
- compact design and a pattern of development to enhance travel efficiency
- reduced dependency on automobile transportation
- high density and mixed-use development based around transportation infrastructure
- green space protection
- material, energy and water conservation
- pedestrian-friendly village centres and an increased sense of community
Urban form is a major influence on reducing transportation energy demand and GHG emissions. Switching a small portion of the population to walking/bus/rail/bike transportation, or even increased telecommuting, is equivalent to a large section of population upgrading to more efficient personal vehicles. All of these options are pursued as part of the Triple E environment.
One explanation for escalating commercial demand in recent years is increasing air conditioning and plug load (computers and printers for example). Offices and retail stores are now the fastest growing sub-sector of commercial buildings, as well as being almost 100 percent likely to have air conditioning and be fully computerized. The Energy Star standard (10 to 15 percent better than average) for appliances and the new universal 1-watt standby limit is effective in the commercial market as well, as it directly targets a major source of the increasing demand.
Fuel-switching to on-site alternative energy sources including geothermal, solar PV and solar thermal account for almost one-third of the total fossil-fuel energy savings of Triple E versus Continuing Trends. Geothermal contributes approximately three percent of the space heating savings. Solar thermal is applied to sub-sectors with high heat loads, such as recreation, hotels and health care, resulting in a savings of approximately 10 percent on water heating. The solar PV contribution increases exponentially but is too small (less than two percent) to be modeled individually.
In addition to major decreases in raw material and manufacturing costs, full deployment requires time for infrastructure to be established, including interconnection standards and trained personnel. To capture its influence, an extra efficiency gain is attached to large electric appliances which effectively displaces a small amount of purchased electricity.
Additionally, on-site commercial combined heat and power grows and displaces almost two percent of the total purchased electricity demand in the commercial sector by 2030. This is accomplished through the alignment of improved technology, reduced costs and a supportive regulatory environment favouring a shift to increased distributed energy.
Canadian commercial secondary energy demand grows at a rate of 0.3 percent over the 2004 to 2030 period, lower than the historical growth rate of 2.5 percent, due to the economic characteristics of Triple E and the assumed energy policies (Figure 5.7). Biofuels and emerging energy in the commercial sector have a zero percent share in 2004 and increase to a two percent share in 2030, as solar and geothermal energy policies are implemented.
Figure 5.7
Canadian Commercial Secondary Energy Demand by Fuel – Triple E
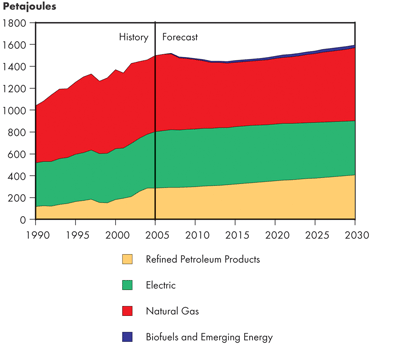
Industrial Secondary Energy Demand
Industrial demand is driven predominately by macroeconomic influences. In Triple E, the demand changes vary by industry type, the most significant of these being a reduction in oil sands, mining and petroleum products activities. As well, industrial demand is influenced by the same core policies as the commercial building sector, including accelerated efficiency standards, subsidies for facility and equipment upgrades, research and development support, and the application of a carbon price. For many reasons, including competition for capital and the disruptions in production flow, energy efficiency upgrades in the industrial sector do not vary widely between scenarios. Small alternative or emerging energy is not directly modeled on the industrial demand side; however, a significant increase in on-site cogeneration, or combined heat and power, is included in the efficiency impact.
Process heat and motor systems are universal loads within all industrial subsections. Energy efficiency improvements in technology and process optimization result in an improvement of approximately one percent annually, a slight improvement on the historical trend. Triple E industrial demand distinguishes itself in the later stages of the scenario when efficiency gains a boost from major process innovation within the most energy-intensive industries. These are the least definitive technologies modeled. Technologies include improved electrolytic processes for aluminium and copper smelting; black liquor gasification for pulp and paper; and improved material handling technology, which allows a larger component of recycled material into the processing stream.
The magnitude of energy demand within the oil and gas sector warrants an analysis independent of other industries. In Triple E, all the policies come together to indicate, or favour, a particular development path in the oil and gas sector. The reduced demand for product and lower prices restricts the pursuit of the most energy intensive and expensive sources of oil and gas. Triple E determines not only what plays are developed, but how they are developed, favouring more efficient processes such as oxy-fuel or gasification for synthetic crude oil production and upgrading. An increase in gasification technology in oil sands would decrease natural gas use and could be used to produce a pure CO2 stream for CO2 capture and storage. This is discussed more fully in the oil section later in this chapter.
Canadian industrial secondary energy demand grows at a rate of 0.3 percent over the 2004 to 2030 period (Figure 5.8). The slower economic growth assumptions for the industrial sector as well as efficiency improvement policies keep demand growth lower than the historical growth rate of 1.8 percent. Total industrial demand grows faster in the first half of the forecast, due to strong oil and gas growth; however, it starts to decline as the oil and gas industry growth tapers off due to lower commodity prices. Non-energy related growth, at 0.6 percent over the forecast, is not adequate to keep total industrial demand increasing. The exclusion of the Mackenzie Valley Pipeline in this scenario, due to lower prices, and the accessibility of the world's best industrial process technology impacts demand.
Figure 5.8
Canadian Industrial Secondary Energy Demand by Fuel – Triple E
('Other' fuel includes coal, coke, coke oven gas, steam, naphtha)
In 2030, the largest provincial energy consumers are Alberta, accounting for 50 percent of industrial energy demand in Canada; Ontario, with 20 percent; and, Quebec following at 13 percent. Fuel shares by province vary significantly, depending on the types of industries, their energy intensities and the availability of fuels[67].
[67] For detailed provincial energy demand data, see Appendix 2.
Food, Fibre and Fossil Fuel Alternatives
Ethanol is the most cited example of bio-based fuels making inroads into established fossil fuel markets. Ethanol biofuel is just one example of the larger, rapidly expanding biomass industry. The biomass (or bio-economy) network includes bioenergy, biofuels and bioproducts and processes. In addition to a petroleum gasoline alternative, bio-based feed stocks can also be found as an alternative or blend for diesel fuel, in electric power generation, in heating systems, and as a chemical feedstock for products such as plastics, paints and detergents.
The biomass industry suggests biological systems (forest and agriculture based) could provide 20 percent of Canada’s energy needs by 2030. It already provides over 60 percent of the heat and power requirements in Canada’s pulp and paper industry. The appeal of biofuels, particularly ethanol, includes reduced greenhouse gas emissions, energy security and agriculture incentives. For these reasons, Canada has a long history of support for the ethanol industry. Until recently, ethanol represented less than one percent of the gasoline fuel share. There are now policies in place to support a target of a five percent share by 2010. The last year has seen an unprecedented amount of activity in building ethanol capacity in North America. As witnessed recently in the U.S., the extensive promotion of corn for ethanol has wide-reaching implications. These include altering or reversing established export trade patterns, impinging on food and livestock producing enterprises and introducing related environment concerns.
Although agriculture is a fairly energy-intensive industry, a large body of peer-reviewed, scientific analysis has shown a net energy gain for fermented corn starch ethanol versus gasoline. (In the U.S., this is estimated to be about a 38 percent gain.) The biofuels industry and policy-makers consider the present situation to be part of a transition to improved efficiencies and lower cost. Ethanol is presently more expensive to produce than gasoline. To reach the Triple E target of 10 percent, it is assumed that technology continues rapid improvement. Cellulosic ethanol, or ethanol from plant fibre (as opposed to fermented grain) is moving into the commercial production stage, and Canadian companies are at the forefront of this technology. This technology has the potential to increase efficiency by a factor of ten. In addition, select crops such as poplar and switch-grass have the potential to improve output efficiency. Improved efficiencies in processes (including combustion, gasification and pyrolysis) will further aid the development of the whole biomass industry.
For further information see:
Canadian Biomass Innovation Network
U.S. Department of Energy, Energy Efficiency & Renewable Energy, Biomass Program
Canadian Renewable Fuels Association
Transportation Energy Demand
Although efficiency, expressed as fuel economy, is the pressure point for the transportation debate, Triple E incorporates a wider view of lifestyle choices and societal values, which have an equally significant impact on transportation energy demand.
Improvements in the efficiency of the basic internal combustion engine (ICE) vehicle are a starting point. The three percent annual improvement target in the first half of the scenario represents a substantial improvement over the historical rate. In addition to the efficiency improvement within each vehicle class (e.g., compact, sub-compact, light truck, med-truck), the transportation sector shows a large reduction in energy use from a shift in consumer purchasing preference toward smaller vehicles. As older vehicles are removed from stock, they are replaced by more efficient vehicles. This could be achieved by replacing a vehicle of a similar size and class with a more advanced technology (e.g., hybrid vehicles) or by replacing the current size vehicle at least one level or class better in efficiency.
Along with efficiency improvements and purchasing habits, Canadian travel behaviour changes significantly. Initially, this change in behaviour involves shifting a section of commuters out of single-occupancy vehicles and into using mass transit. Cities embrace the concept of smart growth, which supports higher densities and more options for personal mobility. This would alter the trend of increased urbanized area (urban sprawl) in Canada, which is contributing to growing personal vehicle kilometres traveled (VKT). In Triple E, a reduction of five percent in VKT due to municipal investment in mass transit options is applied. An additional 10 percent of households have a 50 percent reduction in VKT due to increased density and mixed use (work/live) neighbourhoods by 2030.
The biofuel component of the Triple E transportation policy applies existing and regional short-term targets and expands on these to 2030[68]. The five percent ethanol target presently in place is achievable with existing technology. The 10 percent target for 2030 is based on breakthroughs in biofuel processing; for example, cellulosic ethanol that would significantly improve the biomass to energy output ratio. The same applies for biodiesel. Biodiesel is assumed to make up two percent of the road diesel volume. The success of the biofuels industry in Canada benefits from high level collaboration among energy, environment and rural development strategies.
[68] The Ontario assumption is 5 percent ethanol volume (3.4 percent energy) of total gasoline use in the province by 2007 and up to 10 percent ethanol volume (6.8 percent energy) by 2030. The Saskatchewan assumption is 7.5 percent ethanol volume (5.1 percent energy) of total gasoline use in the province by 2007 and up to 10 percent volume (6.8 percent energy) by 2030. For modeling purposes, the assumption was 10 percent ethanol volume of total gasoline use in Canada by 2030. The assumption is biodiesel will make up two percent volume (1.8 percent energy) of total diesel use in Canada by 2030.
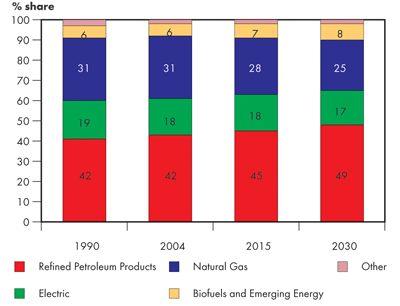
Canadian transportation energy demand grows at a rate of 0.2 percent over the 2004 to 2030 period, which is much lower than the historical growth rate due to slower economic growth, efficiency improvements and behavioural changes (Figure 5.9). The demand shares by fuel for Canada over the forecast illustrate a large drop in gasoline demand shares, resulting from efficiency improvements and the biofuels policies assumed.
Figure 5.9
Canadian Transportation Energy Demand by Fuel – Triple E
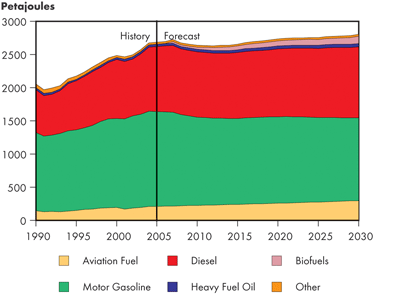
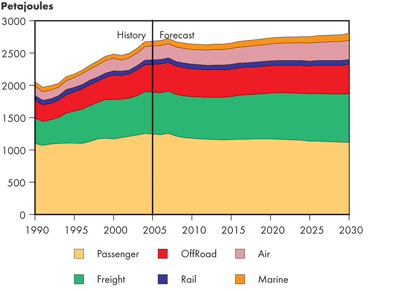
Figure 5.10
Canadian Transportation Energy Demand by Mode – Triple E
Oil Supply
Crude Oil and Equivalent
The Triple E Scenario, with the lowest oil price track and the greatest emphasis on environmental compliance, is the least conducive to expanding oil production levels.
Crude Oil and Bitumen Resources
Canadian crude oil and bitumen resources are the same in the Reference Case and all three scenarios[69].
[69] Canadian crude oil and bitumen resources and are set out in Chapter 3 and in further detail in Appendix 3.
Total Canada Oil Production
In the Triple E Scenario, production expands by about 1.6 percent per year until 2015 and then contracts to negative growth as lower prices and an escalating CO2 price take effect. However, government initiatives for CO2 capture and sequestration support higher levels of improved oil recovery (IOR). Production peaks in 2014 at about 589 000 m³/d (3.71 million b/d) and falls to 482 000 m³/d (3.04 million b/d) by 2030 (Figure 5.11).
Figure 5.11
Total Canada Oil Production – Triple E
Transportation Technologies
For effective reductions in energy demand or emissions, change within the transportation sector is essential. This sector has been a major influence for increasing demand and emissions in Canada in the last 15 years. Increasing average vehicle weight, size and horsepower has essentially cancelled out overall efficiency gains achieved through better technology. However, the popularity of light trucks, including sport utility vehicles (SUVs), appears to have peaked. The market share of new passenger cars and light trucks in Canada has stabilized at approximately 62 percent and 38 percent respectively, according to Natural Resources Canada.
Modeling transportation energy use involves analysis of engine type, fuel type and operating environment. Road transportation, which dominates demand within the transportation sector, was reviewed in detail for potential changes. As an indication of the change that could be expected in the near future in this sector, the U.S. has recommended fuel economy improvements up to four percent a year starting in 2010. This improvement rate would be several fold over the historical rate.
The automotive industry continues to refine and perfect the performance of the internal combustion engine. The last few years have seen improvements such as cylinder deactivation, variable valve timing, Continuously Variable Transmission (CVT) and regenerative braking. Improvements evolve over many years and each may improve fuel economy by a few percentage points. Achieving significant change in transportation demand or GHG emissions would require a full slate of policy options, including consumer purchasing habits and urban planning.
The vehicles of the future could see a convergence of technologies that revolutionize energy demand. Present hybrids are seen as a transitional technology to Plug-in Hybrid vehicles (PIHV), which in turn are seen as a platform for future fuel cell vehicles. These vehicles offer the opportunity to not only 'fuel' from the utility grid, but also the possibility of supplying power to the grid. The future may see a fleet of vehicles interacting with the electrical power grid for a two-way flow of energy, charging at off-peak hours and distributing power back into the grid during critical peak loading periods.
Conventional Crude Oil - WCSB
The low oil price in the Triple E Scenario makes it the least attractive for oil producers; however, large-scale CO2 flooding, aided by a backbone CO2 pipeline, proceeds with government support (see text box). Overall production levels decline, but slow growth resumes late in the scenario as costs align with changing market conditions.
Carbon Dioxide Capture and Storage and the Alberta Backbone CO2 Pipeline
Carbon dioxide capture and storage (CCS) has the potential to significantly reduce GHG emissions from industrial sources and electricity generation. There are three stages to CCS:
- CO2 Capture – CO2 that is usually released into the atmosphere as a by-product of industrial processes is extracted and compressed into a more easily transportable form.
- CO2 Transportation – the captured CO2 is transported by pipeline or tanker to a storage area.
- CO2 Storage – CO2 is stored in geological formations (e.g., active or depleted oil and gas reservoirs, deep saline aquifers, and salt caverns), in the ocean, or in mineral carbonates. It may be permanently stored or used in industrial processes. Carbon dioxide storage in geological formations shows significant potential. Research is ongoing to determine the feasibility of CO2 storage in the ocean or in mineral carbonates. Industrial processes are thought to have limited applications for large reductions in GHG emissions.
Alberta is a good candidate for CCS because of the proximity of large industrial sources of high purity CO2 to the Western Canada Sedimentary Basin (WCSB) (e.g., oil sands facilities, natural gas plants, ammonia plants, and potentially in the future fossil fuel-fired electricity generating plants). The WCSB is a well understood geological basin with infrastructure in place that could be leveraged for CO2 transportation and injection. The development of a large-scale CO2 pipeline that would connect major industrial GHG emitters and storage sites within the province has been proposed. This 'backbone' pipeline would likely run from Fort McMurray and the Edmonton/Fort Saskatchewan area to the Swan Hills and Pembina fields. It could also connect to the Weyburn and Midale fields in Saskatchewan. The CO2 that is captured could be used in IOR. Carbon dioxide captured in excess of IOR demand can be stored in the WCSB.
There are technological and economic challenges to the development of CCS. According to the Intergovernmental Panel on Climate Change, CCS systems can be assembled from existing technologies; however, the combination of these technologies into one system has yet to be proven. As well, there is a gap between the price that IOR industries would be willing to pay for CO2 and the price that industries would demand to cover the costs of capturing CO2. Government policies are likely necessary to close this gap.
Web Resources:
Intergovernmental Panel on Climate Change (IPCC) – Special Report on Carbon Dioxide Capture and Storage
International Energy Agency (IEA) Greenhouse Gas R&D Programme – CO2 Capture and Storage
Government of Canada - Carbon Capture & Storage | CO2 Capture & Storage Roadmap
The effect of the emphasis on CO2 flooding in the Triple E Scenario is to moderate the rate of decline such that the conventional light oil decline rate is 4.2 percent compared with five percent for the Continuing Trends Scenario (Figure 5.13).
Figure 5.12
Alberta Backbone CO2 Pipeline Schematic
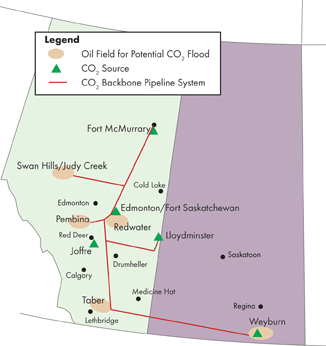
Figure 5.13
WCSB Conventional Oil Production – Triple E
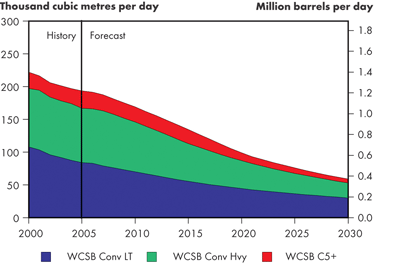
With respect to heavy conventional crude oil, in the Triple E Scenario, lower prices and the costs of more stringent environmental conditions slow the early production momentum. As well, in this more environmentally sensitive scenario, a preference for light crude oil could mean tighter markets for heavy crude. Production falls to 23 000 m³/d (145 thousand b/d) by 2030.
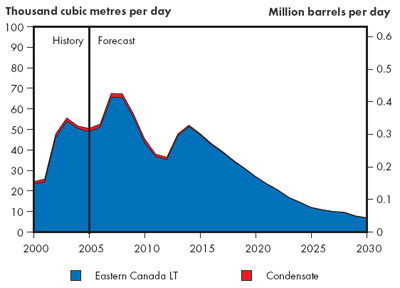
Eastern Canada Light Crude Production
Projections for eastern Canada oil production are dominated by the east coast offshore, with only minor amounts of production expected from Ontario.
The oil price track in the Triple E Scenario is not conducive to oil supply expansion on the East Coast after 2015. In Triple E, no satellite pools are included, and no additional large pool is assumed. Supply peaks at 65 000 m³/d (410 thousand b/d) in 2007 and declines to 6 700 m³/d (42 thousand b/d) by 2030 (Figure 5.14).
Figure 5.14
Eastern Canada Crude Production – Triple E
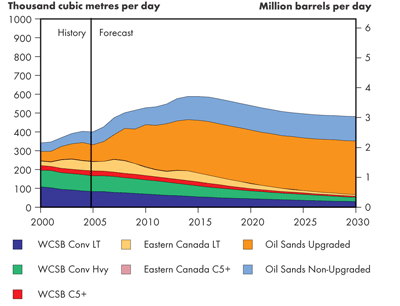
Oil Sands Supply
In Triple E, the lower oil prices and the higher costs of enhanced environmental conditions slow activity precipitously (Figure 5.15). By 2020, only existing projects continue to produce and production declines for several years. After a period of adjustment, slow growth appears after 2027. Production reaches 416 000 m³/d (2.62 million b/d) by 2030 in the Triple E Scenario. Upgraded bitumen volumes total 286 000 m³/d (1.80 million b/d) while non-upgraded volumes total 131 000 m³/d (825 thousand b/d). There is no oil sands production from Saskatchewan assumed in this scenario.
Figure 5.15
Canadian Oil Sands Production – Triple E
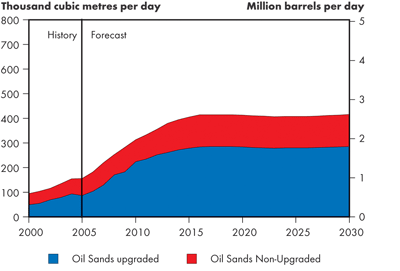
Triple E is the most environmentally conscious scenario, with government incentives in place to reward improved energy efficiency. In this scenario, annual improvement in energy efficiency is assumed to be 1.5 percent, as opposed to 1.0 percent in the other scenarios. In addition, government initiatives to support CO2 capture and storage encourage some switching to bitumen gasification to provide energy for oil sands operations, in spite of low oil prices. In this scenario, the purchased natural gas intensity is reduced from 0.67 Mcf/b in 2005 to 0.30 Mcf/b in 2030. Total purchased natural gas requirements, excluding on-site electricity requirements, increase slightly from 0.65 Bcf/d in 2005 to 0.9 Bcf/d by 2030, in line with muted oil sands production growth.
Supply and Demand Balances
The Triple E Scenario shows a lower production forecast and the earliest decline in conventional production. The domestic demand for petroleum products in 2005 is 290 900 m³/d (1.83 million b/d) and increases to 331 800 m³/d (2.09 million b/d) in 2015. By 2030, demand is 358 600 m³/d (2.26 million b/d). There is a greater focus on the production of cleaner transportation fuels and energy efficiency.
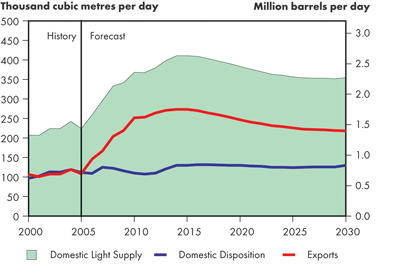
Light Crude Oil - Supply and Demand Balance
Exports of light crude oil increase sharply from 110 200 m³/d (694 thousand b/d) in 2005 to peak at 278 400 m³/d (1.75 million b/d) in 2015. Subsequently, exports drop to 222 600 m³/d (1.40 million b/d) by 2030, a direct result of the sharp decline in conventional light crude oil production and no growth in synthetic crude production (Figure 5.16).
Figure 5.16
Supply and Demand Balance, Light Crude Oil – Triple E
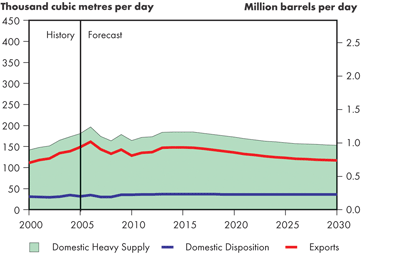
Heavy Crude Oil - Supply and Demand Balance
Exports of heavy crude oil in 2005 are 149 200 m³/d (940 thousand b/d), and remain around that level until 2015, at which point exports begin a steady decline to 117 500 m³/d (740 thousand b/d) by 2030 (Figure 5.17).
Figure 5.17
Supply and Demand Balance, Heavy Crude Oil – Triple E
Natural Gas Supply
Canadian Natural Gas Resource Base
In the declining price environment of the Triple E Scenario, the more costly portions of the unconventional resource base are no longer economic to develop. Consequently, the remaining resource base for coalbed methane (CBM), tight gas and shale gas in Western Canada is reduced relative to the other scenarios[70]. Compared to the Reference Case and Continuing Trends Scenario, the estimated remaining CBM resource base is lower by 26 percent, with tight gas and shale gas remaining resources reduced by almost 40 percent each.
[70] As shown in Appendix 4.
Unlike unconventional gas, the estimate of the remaining conventional resource base is unchanged from the level in the Reference Case and Continuing Trends Scenario. The estimate of the remaining conventional resource base is defined by the minimum reservoir size for each play type that is considered technically feasible for the industry to develop. Within the price range considered, the minimum reservoir sizes adopted in the resource estimate for the Reference Case and Continuing Trends Scenario remain applicable in the Triple E Scenario.
The remaining resource base for frontier projects is also unchanged in Triple E. The frontier resource estimate from the Reference Case and Continuing Trends Scenario incorporates the NEB's best current estimate of technically recoverable marketable gas and is applicable to the range of prices considered. A major challenge in a lower price environment is to overcome technical and locational cost barriers to the construction of infrastructure required to access remote frontier resources. As the likely development of frontier resources over the period to 2030 is only a minor fraction of the total frontier resource base, a downward adjustment to the estimate would be of minimal consequence to the supply outlook.
Production and LNG imports
In this scenario, strong growth in worldwide LNG supply makes imported gas a viable option for a substantial portion of Canadian natural gas requirements. Canadian gas producers may choose to also participate to varying degrees in international LNG opportunities. The availability of abundant LNG imports could eliminate the need to pursue development of some high cost conventional, unconventional and frontier supplies within Canada.
Liquefied Natural Gas
In 2005, Canada and the U.S. represented 26.3 percent of global natural gas consumption. Over 98 percent of this requirement was sourced from within the two countries. However, over 96 percent of worldwide remaining proved gas reserves are estimated to be located outside Canada and the U.S. Under certain market conditions, it may be advantageous for North America to tap into a larger share of the global natural resource base and import greater amounts in the form of ship-borne LNG. Total world LNG trade in 2005 was roughly 567 million m³/d (20 Bcf/d), and future LNG projects either under construction or proposed could potentially increase LNG supply to around 1 700 million m³/d (60 Bcf/d) in the next decade, according to Tristone Capital.
Should such a substantial build up occur, it is possible that the rise in LNG supply could exceed growth in market demand. Under such conditions, LNG suppliers may be forced to compete with each other on price to deliver volumes into already adequately supplied markets. This situation could see prices competed down to the average marginal cost of LNG, currently estimated at roughly $5.04/GJ (US$5.30/MMBtu) delivered to North America, according to Tristone Capital. At this price level, higher-cost domestic gas production would potentially be displaced by incremental LNG imports. Perhaps in recognition of the potential for such price-eroding LNG-on-LNG competition, some current and prospective LNG suppliers have begun very preliminary discussions of the potential to form a gas equivalent of OPEC to assist in cooperatively managing worldwide LNG supply.
Substantial increases in North American LNG import capacity have occurred or are currently under construction including expansions at four of the five existing terminals and seven new terminals (four on the U.S. gulf coast, two in Mexico and the Canaport project in New Brunswick). Over 40 additional import terminals have been proposed for the U.S. and Canada, but only a fraction of these might ever be built. In general, proposals for LNG terminals along the east and west coasts of the U.S. have tended to attract greater site-related local opposition than those along the Gulf coast.
Lastly, North America’s large underground gas storage capacity relative to other major LNG markets (also located primarily in the northern hemisphere) may lead to greater LNG imports during the summer months than during the peak heating season.
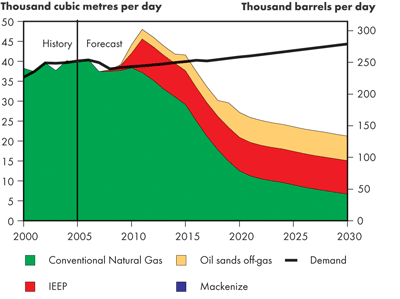
Liquefied natural gas imports are projected to begin in 2009 at 14 million m³/d (0.5 Bcf/d) and grow steadily to 150 million m³/d (5.3 Bcf/d) by 2029, as shown in Figure 5.18. Liquefied natural gas volumes would be offloaded at an estimated seven receiving terminals, ranging in capacity from 14 to 28 million m³/d (0.5 to 1.0 Bcf/d). Import terminals could potentially be developed at appropriate coastal locations in Nova Scotia, New Brunswick, Newfoundland and Labrador, Quebec, and British Columbia. Projected LNG imports are equivalent to 50 percent of domestic production by 2020 and rise steadily to slightly exceed domestic production by the end of the outlook period.
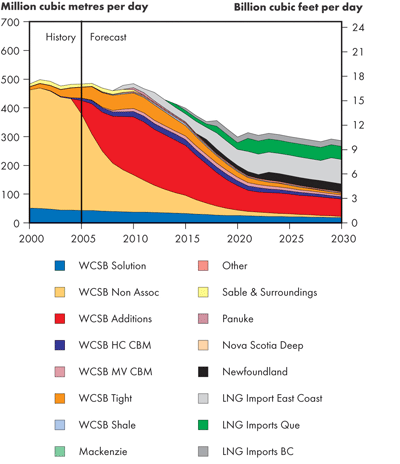
Figure 5.18
Natural Gas Production Outlook – Triple E
Given the lower price environment and access to abundant imports, annual levels of gas drilling in Canada can be reduced substantially to be highly selective of prospects, maximize drilling efficiency and minimize cost escalation. In Western Canada, this would involve drilling an average of 8 000 gas wells annually from 2015 to 2030, a level of activity similar to that experienced in the late 1990s. At these lower drilling rates, conventional gas production in Western Canada would decline fairly rapidly to fall by approximately one-third by 2015 and 80 percent by 2030.
Similarly, the drilling-intensive nature of unconventional resources is not well suited to the minimal activity conditions of Triple E. Tight gas production exhibits modest growth through 2012 before gradually declining to less than 6 million m³/d (0.2 Bcf/d) by 2030. Shale gas struggles to be competitive and never rises above 6 million m³/d (0.2 Bcf/d). Coalbed methane development stabilizes at just over 28 million m³/d (1 Bcf/d) from 2010 to 2019 and then gradually declines by half over the remainder of the projection.
Natural gas developments associated with oil projects off Newfoundland's Grand Banks remain competitive as a substantial component of the original development costs are absorbed by the oil operations. Frontier projects in more remote locations, including Mackenzie Delta gas, are not developed in Triple E as natural gas prices are insufficient to offset the costs of building the required pipeline or shipping infrastructure to connect to markets.
Supply and Demand Balance
Figure 5.19
Supply and Demand Balance, Natural Gas – Triple E
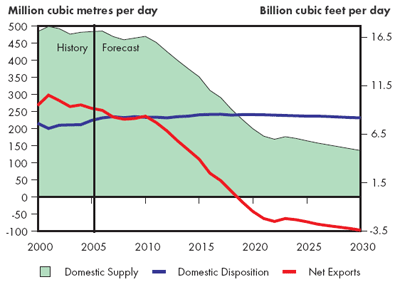
Lower supply costs in Triple E are achieved through a combination of declining Canadian natural gas production and rising LNG imports. This combination provides a gradual reduction in the natural gas supply available in Canada from 481 million m³/d (17 Bcf/d) in 2005 to 397 million m³/d (14 Bcf/d) in 2015 and 283 million m³/d (10 Bcf/d) by 2030. With the U.S. also increasingly served by growing LNG imports, the reduction in natural gas supply in Canada corresponds to a reduction in requirements for Canadian natural gas exports to the U.S.
Energy efficiency improvements and reduced oil sands requirements slow Canadian natural gas demand growth to just seven percent between 2005 and 2030. Canadian demand is satisfied through a combination of Canadian domestic production and LNG imports. The remaining differential between supply and demand averages 62 million m³/d (2.2 Bcf/d) between 2020 and 2030 and would be available for export to the U.S.
In the Triple E Scenario, Canada becomes a net importer of natural gas after 2018. This reflects a conscious strategy to reduce natural gas supply costs by focusing Canadian gas development on lower cost conventional, unconventional and frontier sources, while augmenting supplies with imports of abundant LNG. With the U.S. market also amply supplied with additional LNG imports, a gradual reduction in Canadian natural gas exports to the U.S. would be accommodated under normal market behaviour as the lowest cost option for all market participants. Market imbalance conditions of the type required to invoke a North America Free Trade Agreement (NAFTA) proportionality determination are inconsistent with the low cost, stable international investment and efficient market premises of the Triple E Scenario. A more unsettled international environment is consistent with the Fortified Islands Scenario, where Canadian gas exports to the U.S. are generally increasing rather than decreasing.
Natural Gas Liquids
Supply and Disposition
In the Triple E Scenario, the butane supply and demand balance becomes tight near the end of the outlook period, as WCSB conventional natural gas production decreases and demand for oil sands diluent and motor gasoline blending continues to grow. As a result, no excess supply is available for export as of 2021[71].
[71] Further detail on the propane and butane supply and demand balances can be found in Appendix 3.
Ethane Supply and Demand Balances
Under the Triple E Scenario, demand exceeds supply early in the period, with the ethane shortfall of about 2 900 m³/d (18 thousand b/d) commencing in 2016, increasing to about 23 000 m³/d (145 thousand b/d) by the end of the outlook period (Figure 5.20). The ethane deficit is highest in the Triple E Scenario. This deficit is caused mainly by the significantly lower supply of conventional ethane. In this scenario, WCSB conventional natural gas production is the lowest due to the declining price environment. Moreover, there is no ethane associated with Mackenzie Delta gas, as the pipeline project is assumed to be uneconomic as a result of low natural gas prices.
Figure 5.20
Canadian Ethane Supply and Demand Balance – Triple E
Electricity Supply
Capacity and Generation
In the Triple E Scenario, the combination of energy demand management policies and changes in societal values relating to energy use implies that demand for electricity will start to decline after 2016. Due to the cost of controlling CO2 and other emissions end-use energy prices remain strong despite the decrease in electricity demand and lower crude oil and natural gas prices.
Generation capacity increases by 34 percent between 2005 and 2030 and includes large numbers of wind power facilities and other non-traditional technologies that are forecast to generate electricity intermittently (Figure 5.21). The environmental policy of the Triple E Scenario enables funding of more efficient types of generation and the development of alternatives to traditional generation. It also encourages the advancement of purely environmental applications, such as CO2 capture and storage. Great strides are made in terms of balancing environmental, economic and energy considerations. In this respect, concern about the cost incurred to implement environmental initiatives is balanced by concern for the environment.
Figure 5.21
Canadian Generating Capacity – Triple E
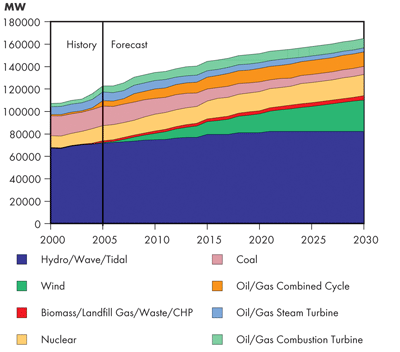
Hydro
In addition to the units listed in the Reference Case, after 2015 the following hydro facilities will be constructed: Peace River Site C (900 MW) in British Columbia and both Conawapa (1 380 MW) and Gull/Keeyask (600 MW) in Manitoba.
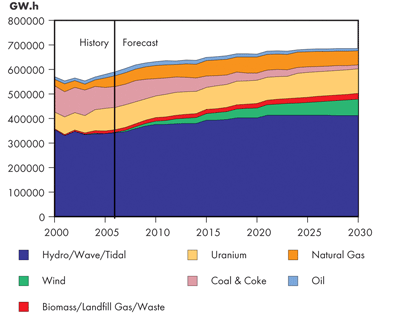
Hydroelectric generation will provide about 60 percent of electricity needs throughout the forecast period (Figure 5.22). Capacity expands to 82 400 MW by 2030, a further increase of 3 000 MW from 2015 and 10 000 MW from 2006.
Figure 5.22
Canadian Generation – Triple E
Nuclear
Total nuclear capacity increases 42 percent between 2005 and 2030, an increase of 5 500 MW from 2005. Assumptions about nuclear capacity are the same as in the Continuing Trends and Fortified Islands Scenarios.
Natural gas-fired
Due to its lower price in this scenario and increased concern about environmental effects, natural gas is the preferred fuel for conventional generation outside Alberta and Saskatchewan.
Coal-fired
Falling demand, combined with competition from natural gas and emerging technologies, indicates that installed coal capacity falls from 14 to 4.3 percent of total installed capacity by 2030. In Alberta and Saskatchewan, there is renewed interest in coal generation starting in 2019 and advanced coal plants equipped for CO2 capture and storage come into service.
Oil-fired
Lower electricity demand, combined with switching to cleaner-burning natural gas, reduces generation from oil-fired units by 37 percent by 2030, despite the construction of 640 MW of bitumen-fired oil sands cogeneration plants in Alberta. In 2020 retiring oil-fired generation in Newfoundland is replaced with a 180 MW natural gas-fired combined-cycle generation.
Emerging Technologies
Wind, small hydro and biomass will continue to be the most popular alternatives to traditional generation technologies, while emerging technologies such as solar, geothermal and wave power are forecast to experience large gains. For example, substantial growth in wave power is evidenced by the addition of 60 MW on the east and west coasts between 2015 and 2030. While these technologies show promise, the impact of emerging technologies is, and will likely remain, small relative to traditional generation types over the outlook period considered.
Wind generation makes up the highest percentage of installed capacity in the Triple E Scenario, reaching 17 percent by 2030. This will require investment in transmission and control systems to compensate for the intermittent nature of wind generation; however, environmental concerns make the investment worthwhile.
Exports, Imports and Interprovincial Transfers
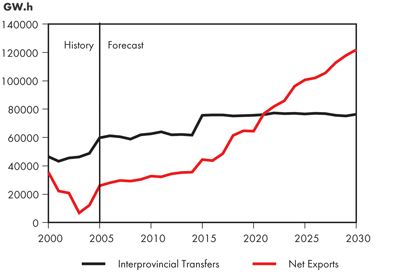
Canadian net exports triple from 2006 to 122 000 GW.h in 2030 (Figure 5.23). This dramatic increase is due in large part to moderation of demand due to energy conservation measures, combined with availability of hydro and other alternative sources of generation that are favoured because of their contribution to reducing GHG emissions. The increase in interprovincial electricity transfers (by 23 percent to 76 400 GW.h in 2030) is much less marked, but still substantial.
Figure 5.23
Interprovincial Transfers and Net Exports – Triple E
Coal
Supply and Demand
In Triple E, there is a shift away from thermal coal used for power generation to gas-fired generation due to environmental concerns. Downward pressure on coal demand is exerted by the retirement of existing coal units, conservation and demand management, more efficient plants and the choice to construct cleaner alternatives to coal plants. It is assumed that CCS technology becomes available around 2020 and is only employed in the Triple E Scenario.
Coal demand and production growth are lowest in Triple E. Canadian coal production decreases to 39 Mt in 2030 from 49 Mt in 2015 because of the decrease in domestic demand of thermal coal. Thermal coal demand decreases to 7 Mt in 2030 from 22 Mt in 2015, with the preference for gas-fired generation choices to replace ageing coal-fired plants. There is a policy shift away from coal used in generation in Triple E, due to environmental concerns. Metallurgical and end-use coal demand decreases to 5 Mt from 7 Mt in 2015 due to declining output in the domestic iron and steel industry. Metallurgical coal production increases somewhat with growth in the world iron and steel industry while thermal coal production decreases significantly to 6 Mt in 2030 from 18 Mt in 2015. Imports of coal are expected to decrease to 5 Mt in 2030 from the initial 10 Mt imported in 2015 while exports are expected to increase to 32 Mt in 2030 from 30 Mt in 2015. Net exports grow moderately by 24 percent between 2015 and 2030 due to the higher level of international trade and significant decrease of imported thermal and metallurgical coal.
Imports of thermal coal decline to 54 percent from 2005 to 2015 due to the phase out of Ontario coal-fired generation and the replacing of coal-fired plants with gas-fired plants. By 2030, imports of metallurgical coal are down 40 percent from 2015 due to declining iron and steel output. Exports of thermal coal remain low in Triple E.
Clean Coal and Carbon Dioxide Capture and Storage
In addition to oil sands plants and chemical facilities, coal-fired generating stations are another potential source of CO2 for CSS. Alberta and Saskatchewan are good candidates for this technology, as they have access to cheap coal and to sites in the WCSB where CO2 could be sequestered as part of IOR projects. Saskatchewan is currently in the final stages of developing a proposal for a 300 MW clean coal power plant equipped to capture 90 percent of the plant’s CO2 emissions. If this project proceeds, it could be in service as early as 2012.
There are a number of potential technologies for power plant CCS, which involve either scrubbing CO2 from the exhaust stream after combustion or removing it from the fuel before power is generated.
Post combustion scrubbing is less efficient, but it allows the plant to operate as a conventional facility if there are technical difficulties with the CO2 scrubbers. For this reason, and because of familiarity with the technology, Saskatchewan has selected the OxyFuel process. The OxyFuel process facilitates post-combustion CO2 scrubbing by enriching the oxygen content of the combustion air.
Pre-combustion scrubbing typically involves combining CO2 capture with an IGCC. Integrated Gasification Combined Cycle plants turn coal into synthesis gas, a mixture of carbon monoxide (CO) and hydrogen (H2), which is then burned in a conventional combined-cycle power plant. Carbon dioxide capture uses the reaction (H2O + CO -> H2 + CO2) to produce hydrogen gas for combustion and CO2 for sequestration. Combining the CO2 capture with the gasification process allows for higher efficiency, but makes the functioning of the plant dependent on the reliability of CO2 capture equipment.
For more information on clean coal technology, see the coal chapter in our Energy Market Assessment: Emerging Technologies in Electricity Generation, Energy Market Assessment March 2006 at www.neb-one.gc.ca.
Greenhouse Gas Emissions
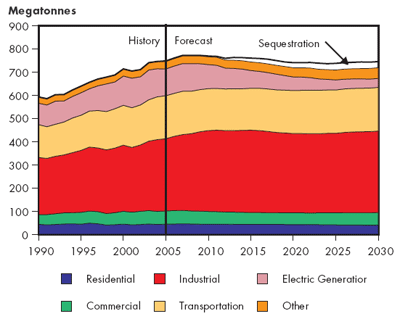
Canadian total GHG emissions in the Triple E Scenario are expected to decrease by 0.1 percent per year between 2004 and 2030 (Figure 5.24). These declines are a result of long-run government policies directed at balancing energy use, environmental impacts and economic growth. The policies focus on improving the energy efficiency of the Canadian economy, including improving vehicle fuel efficiency, buildings and industrial processes. The policies also focus on supporting the development of less GHG-intensive fuels, such as investments in wind generation, ethanol and biodiesel fuel use in the transportation sector and solar and geothermal fuel use in the residential and commercial sectors. Another important component is GHG emissions sequestration in the energy sector, which eliminates 3.6 percent of total emissions in Canada by 2030, bringing the level down from 746 Mt to 719 Mt.
Figure 5.24
Canadian Total GHG Emissions by Sector – Triple E
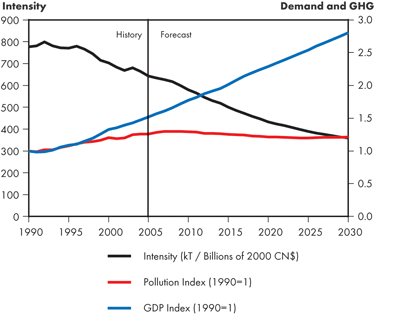
The GHG intensity in Canada declines over the forecast at a rate of 2.3 percent per year in Triple E (Figure 5.25). This is much faster than the historical rate of 1.1 percent as a result of implemented energy policies, alternative energy use increases and sequestration.
Figure 5.25
Canadian Total GHG Intensity – Triple E
In the Triple E Scenario, a number of programs are explored. In developing these assumptions, the NEB reviewed information on current and proposed energy and environmental policies both in Canada and internationally. Dozens of reports and hundreds of policies and programs were evaluated for inclusion. Ultimately, policies were modeled for Canada's Energy Future based on the following criteria:
- programs and policies enjoy broad acceptance - the programs and polices have a long history of use, are frequently employed, or have been repeatedly proposed as solutions;
- pragmatic policies and programs - the literature suggests that the policy or program will lead to a measurable impact on energy demand or emissions within the timeframe of the scenario analysis, or they are derived from best-in-class experiences from around the world;
- build on Canadian experiences - wherever possible, the methods employed to address energy and environmental issues are based on current Canadian programs;
- comprehensive coverage - numerous policies for each demand sector were adopted to ensure that the many factors contributing to decision-making processes were addressed; and
- ease of quantification and modeling - when competing policies satisfied the above filters, the policy that was more straightforward to model or quantify was employed. For example, Canada is developing an emissions trading system for the industrial sector. As a proxy for this program, we have modeled an emissions price. The industrial emissions trading system can be incorporated in future analysis once the details of the system are in place.
Recent federal government announcements have targeted a reduction in Canadian GHG emissions of 20 percent below 2006 levels by the year 2020. In this scenario, Canada only partially meets the target.
This report is an analysis of Canada's possible energy futures. As such, the report focuses strictly on GHG emission reductions from energy-related activities in Canada (e.g., energy efficiency measures, improved energy management systems or investment in CCS). The analysis does not directly focus on GHG emission reduction strategies. For example, the analysis does not incorporate two potential sources of GHG emissions reductions: (a) non-energy related emission reductions such as carbon sequestration in agricultural and forestry; and (b) GHG emission reductions from international mechanisms such as access to Kyoto's Clean Development Mechanism, or international CO2 emissions trading regimes. Consideration of these and others as part of a full spectrum of GHG reduction strategies could go along way in contributing to Canada meeting its target of 20 percent by 2020.
It is also important to note that significant uncertainty exists over how consumers and technology will react to energy demand management and GHG emission policies. Every effort was made to include the most up-to-date information. However, climate policy and technological advancements rapidly evolve. More rapid progression of technology than assumed here or a higher willingness of consumers and industry to make significant lifestyle and production changes would result in a more aggressive GHG emission reduction profile. For example, it is assumed that by 2030 almost 30 Mt per year of GHG emissions are used in IOR or sequestered as a result of the CO2 backbone pipeline. This number could prove to be higher depending on technological advancement and consumer acceptance.
Triple E Issues and Implications
- In Triple E, heightened awareness of energy issues has led to significant changes in the way Canadians use energy. These changes influence every part of life. People live in more densely populated communities, they use more efficient modes of transportation, and efficiency of goods and services is a key criterion shaping purchasing decisions. Progressive government policies encourage many of the changes in this scenario. As a result, despite moderate end-use energy prices and economic growth rates, the overall energy demand in this scenario is the lowest of all three scenarios.
- Access to resources on a worldwide scale and more moderate energy demand growth result in an abundance of energy supplies in the world in the Triple E Scenario. Canada relies on LNG imports for a significant portion of its supply in response to increased security of trade. This reduces the need to access high cost or remote resources within Canada and enable lower energy costs. In addition, availability of global oil supplies lowers oil prices resulting in slower Canadian oil production profiles with the exception of CO2 flooding, aided by a backbone CO2 pipeline.
- As a result of energy efficiency improvements and CCS technologies, GHG emissions decline in this scenario. This is a significant finding as it would be the first time in Canadian history that GHG emissions decline over the long-term as a result of a concerted effort to manage emissions.
- It is also noteworthy that GHG emissions reductions occur despite growing economic activity. In the past, GHG emissions and economic growth have been linked. However, the programs and polices implemented in this scenario weaken this link and allow for economic growth while simultaneously lowering emissions.
- In some ways, Triple E might be regarded as a high-risk scenario. Aggressive energy demand management and GHG emissions reductions programs, technological advancements and cooperative international relations underpin the scenario outcomes. The absence of any of these factors put at risk scenario results.
- The implementation of the government programs and policies included in this scenario is not a simple matter. Significant debate would be required to ensure a balance of various objectives is achieved, including GHG emission reductions, program cost-effectiveness, distributional impacts and minimizing competitiveness implications.
- Many of the technologies require continued advancement to be economic, such as Integrated Gasification Combined Cycle (IGCC) with CCS and cellulosic ethanol technology. In addition, increased penetration of intermittent technologies, such as wind, creates potential reliability issues.
- Similarly, the expectation of more cooperative international relations and a shift in consumers' values to adopt lifestyle changes included in this scenario are highly uncertain.
- Date modified: