ARCHIVED - Canada's Energy Future - Reference Case and Scenarios to 2030 - Energy Market Assessment
This page has been archived on the Web
Information identified as archived is provided for reference, research or recordkeeping purposes. It is not subject to the Government of Canada Web Standards and has not been altered or updated since it was archived. Please contact us to request a format other than those available.
Chapter 2: Energy Context

This section provides background on key issues currently impacting Canada's energy system. Energy context includes a discussion on energy prices, global factors, energy and environmental policy, demand response, emerging technologies, infrastructure, energy in the Canadian economy, energy exports, and reserves.
Price of Energy
Recent high energy prices are being driven by exceptional demand growth in developing countries; shortages in materials, equipment, labour, and engineering services; and geopolitical tensions.
Crude oil prices have been on the rise since January 1999, when WTI prices averaged approximately US$12 per barrel. Less than a decade later, crude oil has traded over US$80 per barrel due to record demand for gasoline, coupled with instability in the refining sector and tight supply and demand conditions. Low spare production capacity and geopolitical concerns surrounding the major producing countries of Iraq, Iran, Nigeria and Saudi Arabia also place upward pressure on the price of crude oil.
North American natural gas prices have trended upward under the influence of the significant increase in world crude oil prices and a tight balance between natural gas supply and demand. The price for natural gas at Henry Hub has increased from approximately US$2.25/GJ (or US$2.35/MMBtu) in January 2000 to around US$6.65/GJ (US$7.00/MMBtu) in 2007. Additionally, hurricane-related supply disruptions have resulted in brief price spikes as high as US$13.30/GJ (US$14.00/MMBtu), while a recent string of mild winters have helped to dampen prices from even higher levels. Except for brief periods when natural gas markets are particularly imbalanced (such as hurricane-related supply disruptions, weather extremes, or if approaching upper or lower limits of storage capacity), natural gas prices have tended to move in relation to oil prices. This relationship typically has gas prices in the lower half of a price range bounded at the bottom by residual fuel oil and at the top by distillate (No. 2 fuel oil) on an energy-equivalent basis. These fuel oil grades represent substitutes for natural gas, in particular in power generation and space heating applications.
With massive coal reserves, not only in North America, but also globally, coal prices have historically risen at very modest rates of one to two percent per year. Since 2003 however, the trend has changed dramatically with coal prices rising at double-digit rates annually. The change coincides with China, one of the top coal-producing countries, becoming a net importer rather than net exporter of coal due to rising internal demand. In 2006, China accounted for 70 percent of global growth in coal consumption.
North American electricity prices have also trended upward under the influence of higher fuel costs for coal, oil, uranium and natural gas; costs of meeting tighter emissions standards; and costs to improve the transmission grid to enhance reliability. Electricity prices can vary between regions depending on the mix of fuels for generation, reserve margins and load growth.
Global Context
In recent years, global growth in energy demand has been led by developing countries, most notably China and India. Energy supply has struggled to keep pace with rising demand. Conventional oil and gas producing regions are maturing and, as they become less productive, are requiring increasing levels of activity and technological intervention to maintain or slow declines in output.
Global oil and gas production and consumption are located in different parts of the world (Figure 2.1). Much of the world's resources are concentrated in politically unstable regions. For instance, geopolitical tensions, economic and political nationalism, and local opposition to development have restricted access to new resources in key regions around the world. This translates into security of supply concerns for large-consuming countries.
Figure 2.1
Global Production and Consumption of Oil and Gas by Area, 2006
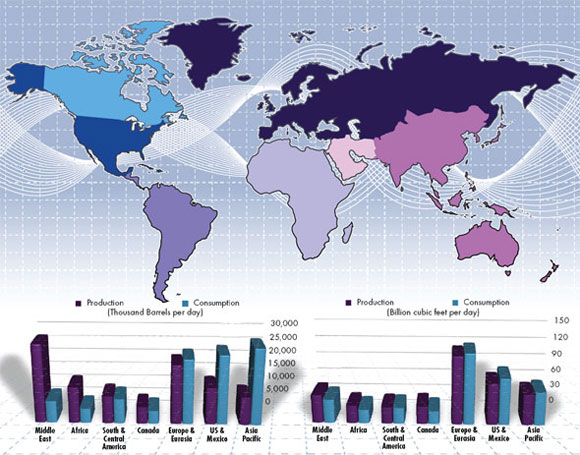
Source: BP Statistical Review of World Energy, 2007
In 2006, the world consumed 10.8 billion tonnes (79.7 billion barrels) in oil equivalent energy, comprised of 36 percent oil, 24 percent natural gas, 28 percent coal, 6 percent nuclear and 6 percent hydro electric energy (Figure 2.2).
Figure 2.2
World Primary Energy Consumption by Fuel Type, 2006
Source: BP Statistical Review of World Energy, 2007
Oil Supply
Currently, Saudi Arabia is the world's top oil producer, producing 1.7 million m³/d (10.8 million b/d) of oil. The U.S. and Canada rank third and seventh, respectively. Only 15 countries[11] are expected to account for up to 84 percent of the net growth in global oil production capacity in the next ten years. In order of absolute growth in capacity, the top five from the list are Russia, Saudi Arabia, Canada, Iraq and Brazil. The U.S. is by far the world's largest market for oil, making up almost 25 percent of total oil demand (3.27 million m³/d or 20.6 million b/d). Canada accounts for only 2.5 percent of total world oil demand (353 thousand m³/d or 2.2 million b/d).
[11] The top 15 are Russia, Saudi Arabia, Canada, Iraq, Brazil, Kazakhstan, Iran, Kuwait, Algeria, Qatar, Libya, Nigeria, UAE, Angola and Azerbaijan.
Gas Supply
Almost 60 percent of the world's natural gas reserves are located in Russia, Iran and Qatar. In 2006, Russia remained the world's largest producer of natural gas, accounting for 21 percent, at 1.67 million m³/d (59.2 Bcf/d) of the total. The U.S. is the second largest producer, but most of the production is consumed domestically. Canada ranks as the third largest producer, responsible for over six percent, but future production is expected to remain flat or decline. Asia is the largest regional market for liquefied natural gas (LNG), acquiring 64 percent of total world imports, with Japan importing the bulk of these supplies.
Coal Supply
Unlike oil and gas reserves, coal is widely distributed throughout the world. Coal is also abundantly available. Worldwide, the reserve-to-production ratio for coal is estimated to be 147 years, whereas the reserve-to-production ratio for oil is 40.5 years and natural gas is 63.3 years. Coal is the world's fastest growing fuel in terms of both world consumption and production. The bulk of this fuel is consumed and produced by China. Canada accounts for only one percent of the world's supply and demand for coal.
In 2006, five countries, U.S., China, Russia, Japan and India, accounted for over 50 percent of the world's primary energy demand[12]. Canada accounted for approximately three percent. In 2006, compared to 2000, China and India's collective share increased by almost six percent, while shares in the other countries declined modestly. Many developed countries are attempting to reduce the rate of increase in energy demand. However, consumption in developing countries, such as China, is increasing in order to fuel rapidly expanding economies.
[12] BP Statistical Review of World Energy, 2007. U.S., China, Russia, Japan and India make up 52.1 percent of world primary energy demand.
Energy and Environmental Policy Developments
Energy and environmental policy responsibilities within Canada are divided between federal and provincial governments. There has recently been an unprecedented level of activity in this area. With the growing importance of energy issues, the provinces have responded with the release of energy strategies and policy directives. In early 2007, British Columbia released its Vision for Clean Energy Leadership, focusing on energy efficiency, electricity self-sufficiency, net zero emissions from thermal generation, renewable portfolio standards, and alternative fuels. Alberta's Climate Change and Emissions Management Amendment Act and the Nine Point Bio-Energy Strategy focus on emission intensity reductions from large final emitters and expanding the bio-energy industry. Ontario's recent policy initiative released in April 2007 focuses on energy efficiency and electric sector changes. Several other policy directives have been announced previously, highlighting conservation, small-scale alternative energy projects, net metering, and infrastructure financing, all to promote efficiency in the use of energy while reducing emissions. The key elements of Quebec's energy strategy released in 2006 include accelerated development of hydroelectric resources and wind power, energy efficiency for all forms and uses, and innovation. Nova Scotia has also released several policy directives focusing on alternative energy sources, including tidal power and hybrid transit, energy efficiency, and greenhouse gas (GHG) emission reductions.
Between 1990 and 2004, Canada's GHG emissions increased by 26 percent. This increase is a result of a number of factors, including increasing population and economic growth. Growth in energy-intensive sectors of the economy, such as in oil production, have been a major influence on fuel consumption and emissions increases. In addition to energy policy directives, there have also been several climate change[13] action plans released by provinces including British Columbia, Alberta, Manitoba, Quebec, Nova Scotia, Newfoundland and Labrador, and the Northwest Territories
[13] Climate change is an altering of long-term weather patterns that includes temperatures and precipitation. The international scientific community agrees that climate change is occurring as a result of human activity, including the burning of fossil fuels which emit greenhouse gases into the atmosphere. For further information see: Intergovernmental Panel on Climate Change.
Canadians are beginning to recognize a personal responsibility for environmental action[14]. This public concern is driving more robust policies and programs. Although not currently implemented, the federal government has recently announced a number of policies that will require emissions reductions from the industrial sector. The federal government's 2007 plan, Turning the Corner: An Action Plan to Reduce Greenhouse Gases and Air Pollution, targets absolute reductions in GHGs by 20 percent from 2006 levels by the year 2020. In addition, the plan calls for reduction of industrial air pollution by one half by 2015[15].
[14] For example 91 percent of respondents claim “I feel a moral responsibility to improve the environment for future generations” Decima Research, The Mood of Canada, September 2006. Anderson, Bruce. Decima Insights, January 12, 2007.
[15] Air pollution includes nitrogen oxides (NOx), sulphur oxides (SOx), volatile organic compounds (VOCs), and particulate matter (PM). It can also include other air pollutants, such as benzene and mercury. Air pollution contributes to health and environmental impacts, such as smog and acid rain.
The policy developments at both provincial and federal levels constitute important steps in the achievement of Canada's energy and environment objectives. These developments are still a work-in-progress. Not all provinces are at a similar stage of policy development, and not all sectors are equally targeted for improvements in energy consumption and GHG emission reductions. Policies and programs that achieve broad support will need to balance economic, energy and environmental objectives.
Demand Response[16]
High energy prices would intuitively suggest a decrease in demand. However, demand response in energy use is relatively inflexible, particularly in the short term. This has been a subject of some discussion especially in the context of high energy prices. The pattern of energy consumption is largely predetermined by the make-up of the existing stock of energy-using devices. Since this stock has long life, the possibilities for demand reductions are limited. In addition, as consumers' incomes increase, they purchase more energy-using goods and services, which contributes to energy demand growth. Generally, this is what is being reflected in aggregate demand data available to date.
[16] For purpose of this discussion, demand response refers to market forces and the relationship between energy prices, income and energy consumption. This is distinguished from electricity demand response, which refers to negotiated or voluntary intermittent electricity reduction.
Despite the inherent inflexibility and the contribution to energy demand growth from the income effect, there are some indications that consumers are reacting to higher prices. Recent qualitative evidence suggests Canadians are responding to increased energy costs by adjusting lifestyles and spending habits. Although the total volume of gasoline sold in Canada continues to increase, there are indications that high and volatile prices are impacting vehicle purchasing trends. In fact, in 2006, for the first time ever, more than half of all retail car buyers bought small fuel-efficient vehicles[17]. However, this trend will take years to make a sizable impact on demand due to the turnover rate of vehicles. As well, energy efficiency improvements do not necessarily translate directly into energy demand reductions as decreased operating costs from improved fuel economy could lead to increased vehicle kilometers traveled (VKT).
[17] Van Praet, Nicolas. Smaller cars a bigger draw as drivers seek greater fuel economy. National Post, March 1, 2007.
There are also many low-cost investments that could yield significant savings within the existing energy system, which may become evident in the future. Homeowners are actively looking for ways to reduce energy costs. A recent survey in Ontario found 9 out of 10 home buyers in Toronto and Ottawa in 2006 were looking for increased energy efficiency[18]. Similarly, interest in programs offered by Natural Resources Canada (NRCan) for industrial, commercial and residential energy efficiency are on the rise.
[18] Energy Evolution, 2006. Builders Say Energy Efficiency Targets Will Affect Affordability. September 25, 2006.
In the longer term, consumers have more flexibility to react to higher energy prices, government programs and societal value changes as established stock can be replaced with more efficient energy-using equipment, and behaviours can be shaped to reduce demand.
New and Emerging Technologies
Technology is seen as an important part of the solution for energy supply and environmental challenges. There have been rapid technology advances in the last few decades, and this trend is not likely to diminish. On the supply side, technological advances are pursued to maintain current levels of conventional production, gain access to unconventional resources, and develop alternative sources of energy. On the demand side, more energy-efficient technologies are being developed. The main consideration is what technologies should be supported, to what extent, and to what ultimate end-goal.
In many ways, Canada is a leader in energy innovation. The extraction of unconventional oil and gas, Advanced Canadian Deuterium (CANDU) Reactors (ACR), alternative fuels, fuel cell research, and cold-climate building design, are examples demonstrating Canadian innovation. Over 30 years ago, unique public private investment strategies led to the development of oil sands research facilities and operating oil sands plays. Over the next 30 years, technologies such as the large-scale deployment of nuclear power generation, clean coal, oil sands gasification with carbon dioxide (CO2) capture and storage, bio-based alternative fuels, advanced transportation technologies, and aggressive energy efficiency improvements are possible. Although not explored in this report, it is also possible that breakthrough technologies could result in fundamental changes to the way Canadians produce or consume energy. Examples include the development of a cost-effective method to tap into Canada's large gas hydrate resources, the evolution of a hydrogen economy or a breakthrough in fusion.
The development of technologies is shaped by future social and political priorities. In recent years, energy research has not kept pace with economic growth[19]. The scenarios in Canada's Energy Future depict the possible context for exploring technology opportunities.
[19] Private research and development investment energy sector: 0 .75percent revenue; non-energy sector 3.8 percent. For more information see Natural Resources Canada, Powerful Connections - Priorities and Directions in Energy Science and Technology in Canada, National Advisory Panel on Sustainable Energy Science and Technology, 2006.
Infrastructure
New infrastructure requirements and accompanying implications reflect the diversity and extensive nature of Canada's energy economy. While the oil, natural gas and electricity sectors indicate unique challenges, all sectors face opposition to siting new facilities, no matter the energy source. Additions to infrastructure ranging from oil sands developments to electricity generation and transmission also need to be undertaken in consideration of immediate air quality issues and the longer-term need to reduce GHG emissions. Other factors impacting timely execution of new infrastructure plans include the availability of skilled labour and professional services, as well as escalating costs for materials and services.
Given current and anticipated oil prices and substantial commitments already made by developers, the oil sands seem destined to dominate upstream development for many more years. Uncertainty remains about the extent and timing of development given concerns about availability of water for processing, rising costs, availability of skills, and availability of sufficient diluent for blending bitumen. The substantial increase in oil sands output suggests that new markets will need to be accessed. In this context, there are many new pipeline proposals currently under consideration which will supply areas in the U.S. beyond traditional markets. Industry could also turn their attention in the future towards reaching offshore markets. Refiners need to address changes in crude oil slates brought about by greatly increased oil sands output through increased investment. Sustained higher oil prices are causing resource owners, particularly provinces themselves, to reconsider royalty regimes. This could also pose implications for the completion and timing of new resource developments in conventional areas and in frontier areas.
The North American gas market is evolving from one of self-sufficiency to an increasing requirement for offshore LNG. The scope of imports into North America will depend to some extent on the success of gas projects in Alaska, Mackenzie Delta, the East Coast, and non-conventional developments, such as coalbed methane (CBM) in Western Canada and the U.S. Rockies, with additional implications for the current and emerging pipeline infrastructure. Recent cost escalation for northern projects adds to the uncertainty about in-service dates and raises concerns about whether these projects will proceed. Simultaneously, natural gas demand is expected to experience continued growth, particularly in power generation, which will create demand for new gas services to the power sector, including gas storage. Another area of growth is the demand for gas in oil sands production, which also presents an opportunity for the efficient production of electricity from waste heat recovery (cogeneration).
Across Canada, provincial energy strategies generally, and the electricity strategies specifically, are under ongoing review to ensure adequacy of generation and environmental objectives. Substantial new generation infrastructure for conventional generation and emerging technologies (e.g., wind, small hydro and biomass) is either planned or under development. How each province plans to meet its unique needs varies according to its market structure and generation resources (for example, Newfoundland and Labrador, Quebec, Manitoba and British Columbia tend to be dominated by hydro developments, whereas other provinces have a mix of thermal and hydro resources). Currently, after many years of little or no growth in transmission, significant investments in intra-provincial projects (e.g., Alberta, Ontario) and interprovincial interconnections (e.g., Quebec to Ontario, Manitoba to Ontario) are contemplated. Additionally, expanded U.S. interconnections are also under consideration.
Energy in the Canadian Economy
Canadians use energy at one of the highest rates per capita in the world. This can be largely attributed to our climate[20], type of industries, and vast land area to transport people and goods. Canada is also an industrious country. In 2005, Canada was ranked 14th out of all countries in the world in gross domestic product (GDP) per capita.[21]
[20] Canada is in the top ten countries in the world for heating degree days. Climate Analysis Indicators Tool: Data note: Heating and Cooling Degree Days; takes into account the population densities across each country.
[21] International Monetary Fund. Canada averages US$35,105 per capita in 2005 dollars.
The energy industry plays a vital role in the Canadian economy. The energy industry[22] directly accounted for 9.9 percent[23] of Canada's GDP in 2005 and directly employed 2.3 percent of Canada's labour force[24] in 2005. Energy export revenue totaled $87.0 billion in 2005, which accounted for 20 percent of the value of all Canadian goods and services exported. This energy proportion has continually increased since 1998, when energy exports accounted for 8.1 percent of the value of total exports. Net energy exports in 2005 were considerable at $48.1 billion and have continuously grown since the 1990 level of $6.7 billion[25]. There are also many indirect and spin-off effects of the energy industry, affecting activities and work loads in sectors like government, finance, construction, metal and aluminium, emerging technologies and research, consulting, and numerous other local effects.
[22] Including all oil and gas and support activities, coal mining, electric and natural gas utilities, refineries, the oil and gas pipeline sector and the petrochemical sector.
[23] In current 1997 dollars, it is six percent. The percent is lower in 1997 dollars because some of the commodity prices used to calculate GDP in 1997 dollars are much lower than the 2005 prices (higher inflation rates from 1997 to 2005).
[24] This is 365,400 people. If gasoline stations are excluded it is 290,400 people. Source: Labour Force Survey, Statistics Canada.
[25] The 1990 net export dollar value is from Statistics Canada's Energy Statistics Handbook, Table 3.2.
Energy Exports
Canada has very large supplies of oil, natural gas, electricity and coal relative to the size of its domestic energy markets. With wide fluctuations in weather-induced demand and the vast physical distances between supply sources and markets, the development of interconnecting pipeline and transmission infrastructure would not have been economically viable without the inclusion of export volumes to absorb a share of the costs. In 2006, for the first time in many years, the value of Canadian net oil exports to the U.S. exceeded that of natural gas net exports. Growing oil exports are the result of production increases from oil sands and frontier oil off the East Coast.
An ongoing issue for oil and natural gas liquids is the extent to which energy is exported in its lower-value raw form rather than processed within Canada into a higher value product for export. The latter generates higher export revenues; however, it also incurs the costs of developing processing infrastructure and challenges traditional economic rationale, which suggests benefits to processing goods closer to the end-use market rather than at the point of extraction.
Natural gas export volumes have recently dropped due to declining production from mature fields and increasing domestic demand. Should this trend continue, there may be costs associated with underutilized infrastructure.
Electricity exports are a consequence of infrastructure sized to accommodate winter peaks, which opens up the potential to be underutilized for the remainder of the year. The ability to export and import during off-peak and peak periods enhances reliability and system efficiency. The concept of developing more east–west transmission capacity could result in less north–south trade with the U.S. Similarly, drier and warmer conditions could result in lower exports due to less hydroelectric power being available for export and higher consumption of electricity for air conditioning during the summer.
Canadian coal imports and exports are affected by electricity generation capacity additions, generation choices and the competitiveness of Canadian coal in international markets. Canadian imports of thermal coal are impacted by the closure of Ontario's coal-fired capacity, and Canadian exports of metallurgical coal will be impacted by the state of the iron and steel industry abroad and competitiveness of Canadian producers.
Canadian Reserves
The starting point for developing long-term projections of crude oil and natural gas production is to review the reserve potential. Conventional resources for oil and natural gas are based on estimates published by provincial energy agencies, offshore petroleum boards, the Geological Survey of Canada (GSC), and the NEB. Bitumen resource estimates are adopted from the Alberta Energy Utilities Board (EUB)[26].
[26] Both the Oil & Gas Journal (Pennwell Petroleum Group) and the BP Statistical Review of World Energy recognized the EUB estimates for established reserves of bitumen in their listing of world oil reserves.
As of year-end 2005, Canada's remaining oil reserves stood at 28.2 billion cubic metres (178 billion barrels), composed of 27.5 billion cubic metres (173 billion barrels) of bitumen reserves and 0.7 billion cubic metres (4.2 billion barrels) of conventional crude oil reserves (Figure 2.3).
Figure 2.3
Estimated Proved Oil Reserves, 2005
Source: BP Statistical Review of World Energy, 2007
Based on Canada's immense volume of recoverable reserves of oil sands bitumen, Canada ranks second in the world in terms of oil reserves, behind Saudi Arabia.
According to the BP Statistical Review of World Energy 2007, Canada accounts for 0.9 percent of the world's proven natural gas reserves and 6.7 percent of world production. The NEB's estimate of remaining marketable gas reserves at the end of 2005 is 1 619 billion m³ (57.2 Tcf). Reserve additions were 212 billion m³ (7.5 Tcf) in 2005 and replaced 125 percent of annual production. The rise in remaining reserves reflected increased exploration and improved recovery in known gas fields, as a consequence of the strong increase in natural gas prices during 2005. Initial reserves increased in Alberta, British Columbia and Saskatchewan in 2005, while Ontario and frontier regions were down slightly. With the decline in natural gas prices in 2006, some of the price-related increase in reserves during 2005 may be reversed in 2006[27]. Since natural gas markets were deregulated in the mid-1980s, the ratio of remaining gas reserves to annual production (or reserves life index) has declined from over 20 to be maintained at a relatively stable 8 to 10 since 1999.
[27] Complete data for 2006 unavailable at time of writing.
Coal reserves are abundant throughout the world and account for over half of remaining hydrocarbon reserves. Canada also has large coal reserves (Table 2.1). At current prices, coal reserves are approximately eight percent of resources, sufficient to meet demand for about a century at the current rate of production, compared to a decade for natural gas and conventional oil. Oil sands reserves are sufficient to meet demand for almost five centuries at the current rate of production, but this is expected to drop as oil sands production is increasing rapidly.
Table 2.1
Canadian Coal Resources
| (million tonnes) | Anthracite | Bituminous | Sub-Bituminous | Lignite | Total |
|---|---|---|---|---|---|
| Western Canada[1] | 2 515 | 29 255 | 34 470 | 10 975 | 77 215 |
| Eastern Canada[2] | 0 | 1 480 | 180 | 0 | 1 660 |
| Total | 2 515 | 30 735 | 34 650 | 10 975 | 78 875 |
| [1] Saskatchewan, Alberta, British Columbia and the Territories. [2] Nova Scotia, New Brunswick and Ontario. Source: Coal Resources of Canada, Geological Survey of Canada, 1989 |
|||||
- Date modified: