Canada’s Energy Futures 2021 Fact Sheet: Energy Demand
Canada’s Energy Futures 2021 Fact Sheet: Energy Demand [PDF 294 KB]
Data and Figures [EXCEL 749 KB]
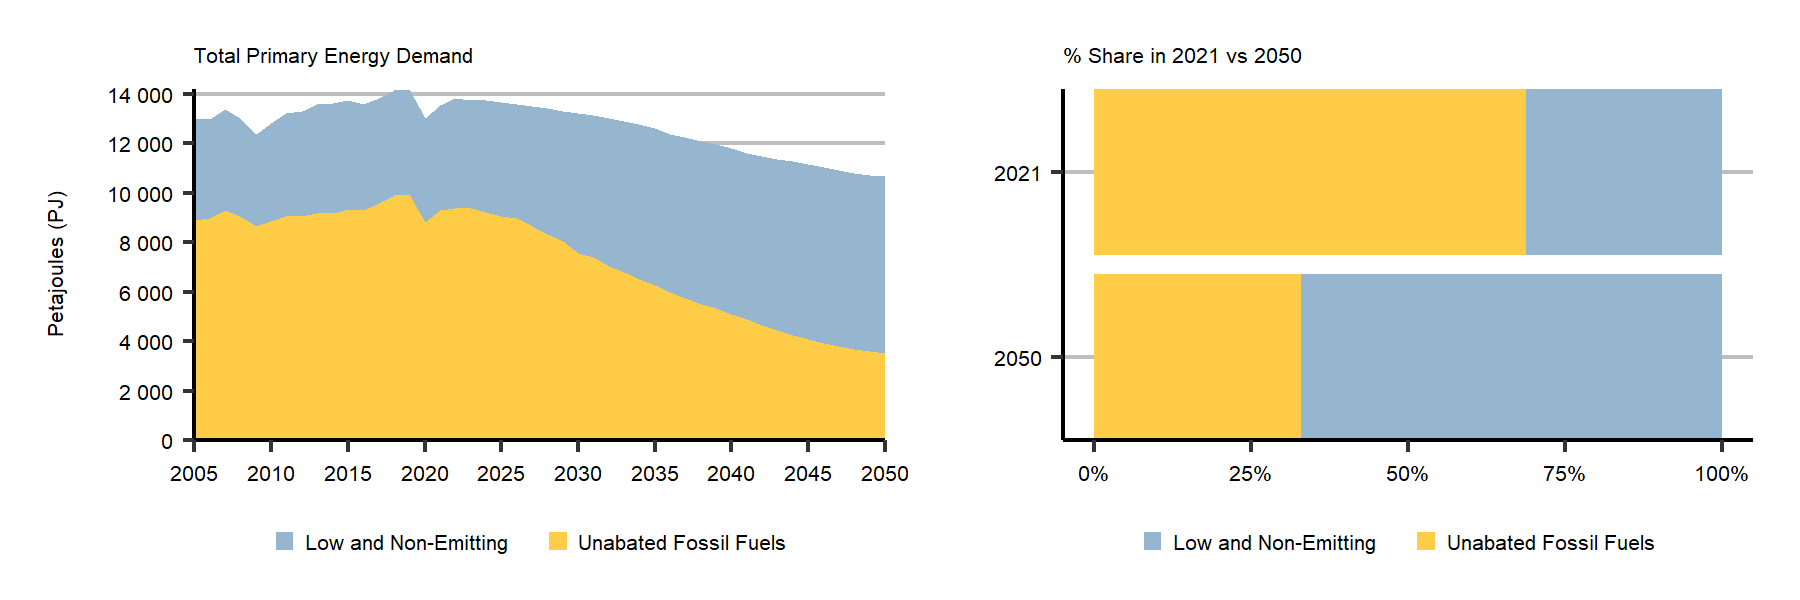
Primary Energy Demand in the Evolving Policies Scenario
In the Evolving Policies Scenario, combustion of fossil fuels whose emissions are not captured falls, while use of low and non-emitting energy sources increases.
Unabated fossil fuel use falls 60% by 2050 from current levels
Click to enlarge
Description
Description: This figure shows two charts. The first stacked area chart compares low emissions energy demand with unabated fossil fuel energy demand in the Evolving Policies Scenario. The vertical axis units are Petajoules (PJ), and the horizontal axis shows years from 2005 to 2050. In 2021, unabated fossil fuel energy demand is about 9 300 PJ, and low emissions energy demand is about 4 200 PJ. By 2050, the share of unabated fossil fuel energy demand is about 3 500 PJ, and low-emission energy demand is about 7 200 PJ. The second chart compares shares of low-emission and unabated fossil fuel energy demand in 2021 and 2050 in the Evolving Policies Scenario. In 2021, the share of low emissions energy demand is 31%, and 66% by 2050, with unabated fossil fuel energy demand making up the remainder.
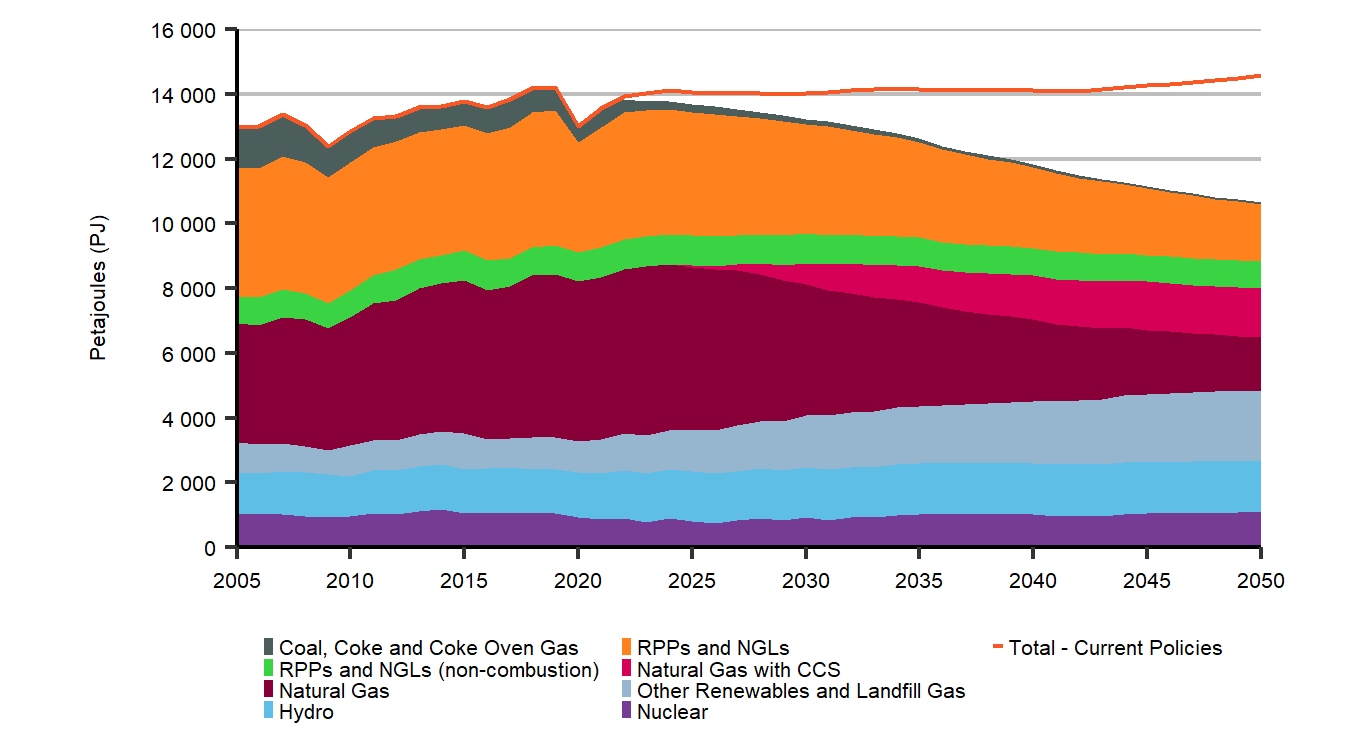
Primary Energy Demand by Fuel and Share of Total Demand - Evolving Policies Scenario
Click to enlarge
Description
Description: This chart breaks down primary energy demands in the Evolving Policies Scenario, by fuel, throughout the projection period. It also shows total primary energy demand for the Current Policies Scenario. In the Evolving Scenario, coal, coke and coke oven gas demand decreases from 713 petajoules (PJ) in 2019 to 58 PJ in 2050. Refined petroleum product (RPP) demand decreases from 5 067 PJ in 2019 to 2 601 PJ in 2050. Natural gas demand decreases from 5 045 PJ in 2019 to 1 512 PJ in 2050. Hydro demands increase from 1 353 PJ in 2019 to 1 607 PJ in 2050. Nuclear demands increase from 1 057 PJ in 2019, to 1 073 PJ in 2050. Other renewables and landfill gas demand increases from 984 PJ in 2019, to 2 148 PJ in 2050. Total primary demand in the Evolving Policies Scenario decreases from 14 219 PJ in 2019, to 10 668 PJ in 2050, compared to an increase to 14 567 PJ in the Current Policies Scenario.
In the Evolving Policies Scenario, total primary demand falls 21%, from 2021 to 2050, driven by reductions in fossil fuel use. In the Current Policies Scenario, total primary demand increases by 7.5% from 2021 to 2050.
In the Evolving Policies Scenario, the relative share of refined petroleum products, coal, and natural gas without carbon capture and storage (CCS) declines. The share of non-hydro renewables and natural gas increase significantly. Demands for hydro and nuclear remain relatively stable in the projection, so their share gradually increases as total demand declines.
Click to enlarge
Description
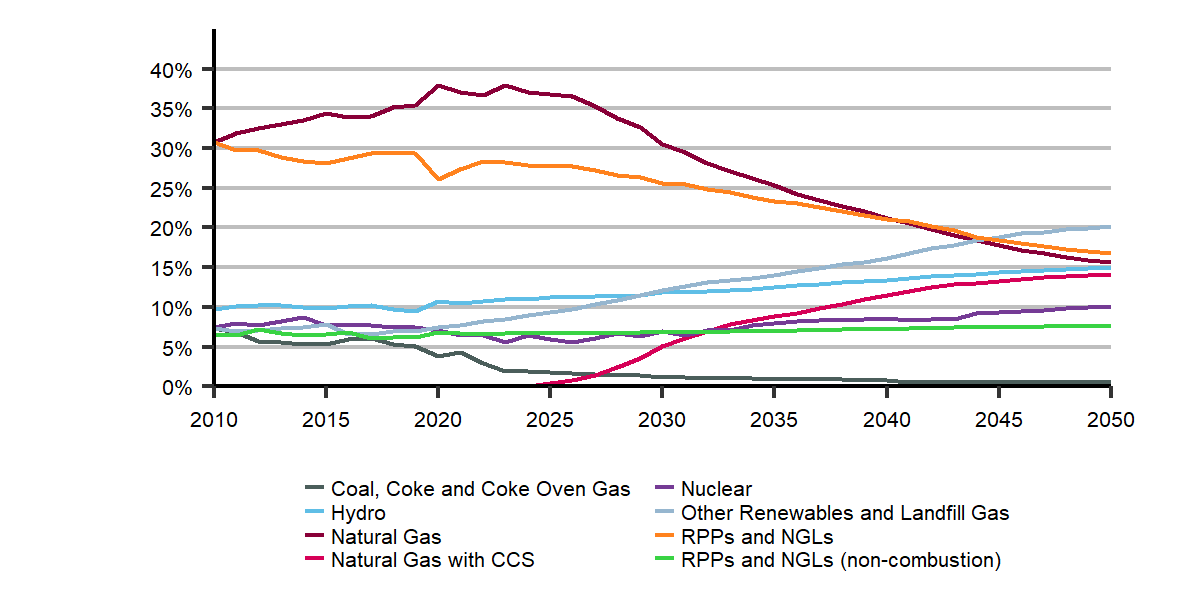
Description: This chart compares primary energy use from 2010 to 2050, by fuel in the Evolving Policies Scenario. Coal, Coke, and Coke Oven Gas’ share decreases from 7% in 2010 to 1% in 2050. Hydro’s share increases from 10% in 2010 to 15% in 2050. Natural gas’ (without CCS) share declines from 31% to 16%. Natural gas with CCS increases from 1% in 2027 to 14% in 2050. Nuclear’s share increases from 7% in 2010 to 10% in 2050. Other Renewables and Landfill Gases’ share increases from 7% in 2010 to 20% in 2050. RPP’s share decreases from 37% in 2010 to 24% in 2050.
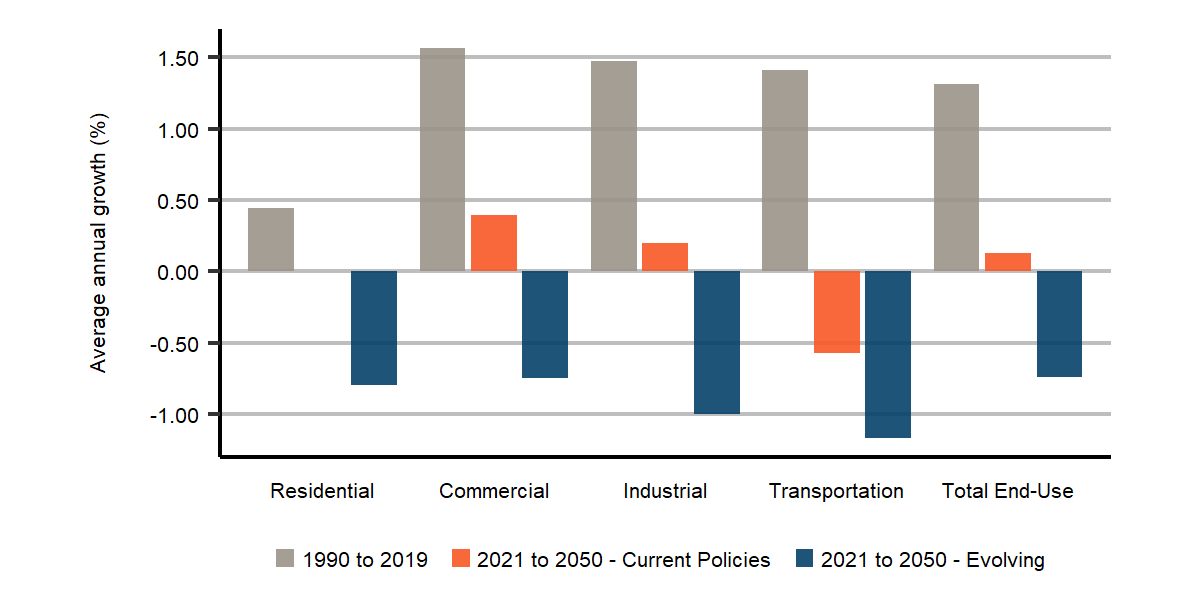
Sectoral End-Use Demand Changes - Evolving Policies Scenario
Click to enlarge
Description
Description: This chart compares total end-use demand annual average growth rates by sector. From 1990 to 2019, residential end-use demand increased by 0.4% per year. In the Evolving Policies and Current Policies scenarios, end-use growth averages -0.8% and 0.0% respectively. From 1990 to 2019, commercial end-use demand increased by 1.6% per year. In the Evolving Policies and Current Policies scenarios, end-use growth averages -1.3% and 0.7% respectively. From 1990 to 2019, industrial end-use demand increased by 1.5% per year. In the Evolving Policies and Current Policies scenarios, end-use growth averages -0.8% and 0.3% respectively. From 1990 to 2019, transportation end-use demand increased by 1.4% per year. In the Evolving Policies and Current Policies scenarios, end-use growth averages -1.0% and 0.0% respectively. Total end-use demand from 1990 to 2019 increases by 1.3% on average. In the Evolving Policies and Current Policies scenarios, total end-use demand growth averages -0.7% and 0.3%, respectively.
Canadian energy use demand is projected to decline to 2050. These declines result from several drivers, including macroeconomics, energy production trends, energy efficiency improvements, policies, technology advancements, and market developments.
End-use demand is energy used by final consumers. It includes electricity and excludes the fuel source used to generate the electricity.
Sectoral End-Use Demand, by Fuel - Evolving Policies Scenario
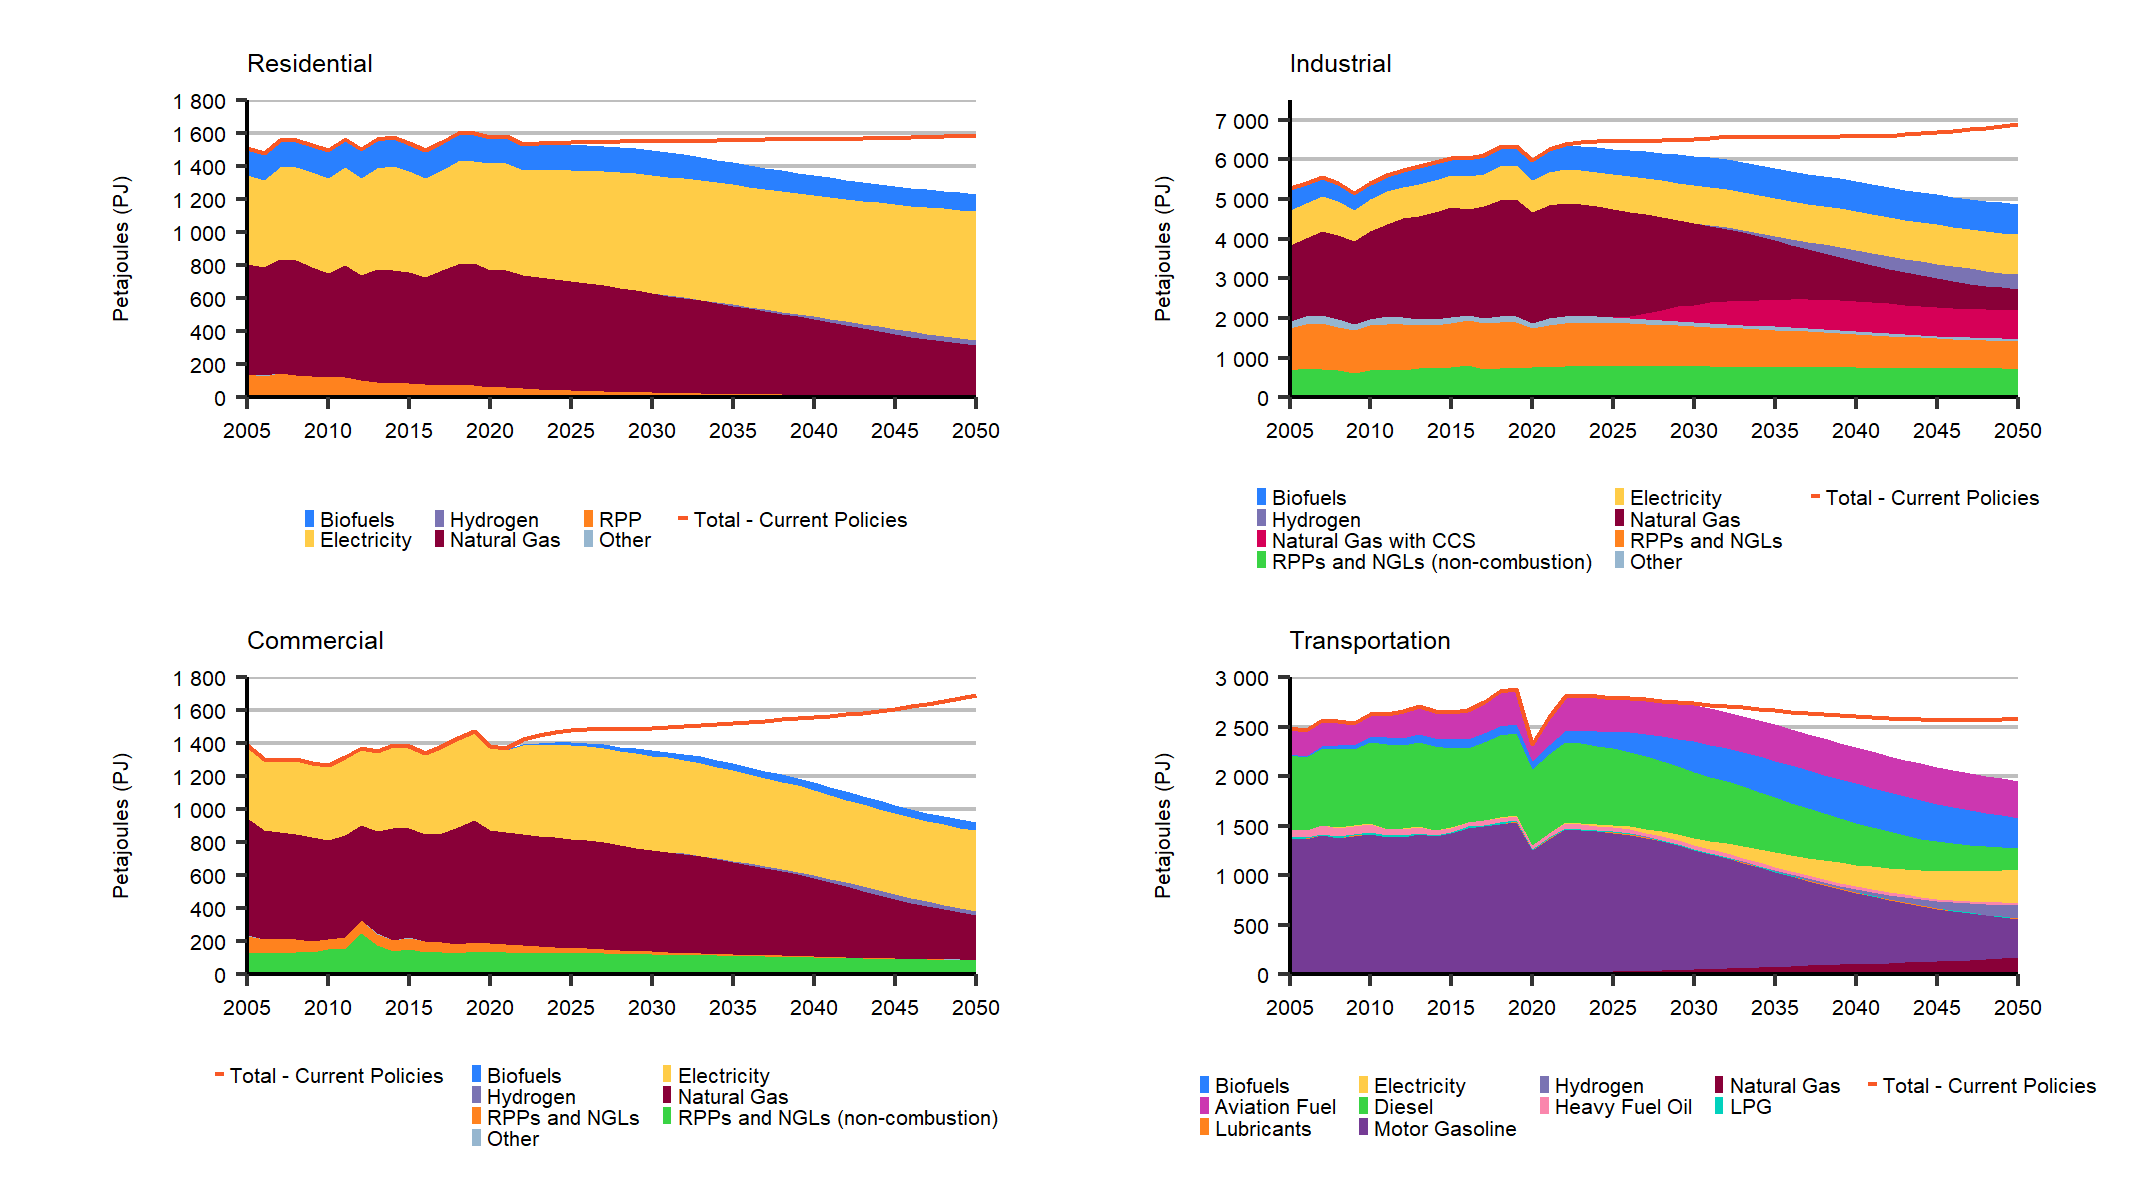
Click to enlarge
Description
Description:
Residential: This chart breaks down fuel demand for the residential sector in the Evolving Policies Scenario. Electricity demand increases from 574 PJ in 2010 to 785 PJ in 2050. Natural gas demand decreases from 630 PJ in 2010 to 303 PJ in 2050. RPPs and NGL demands decrease from 121 PJ in 2010 to 10 PJ in 2050. Biofuel demands decrease from 171 PJ in 2010 to 134 in 2050. Lastly, other fuel demands stay at 0 PJ throughout the projection period.
Commercial: This chart breaks down fuel demand for the commercial sector in the Evolving Policies Scenario. Electricity demand increases from 456 PJ in 2010 to 485 PJ in 2050. Natural gas demand decreases from 598 PJ in 2010 to 270 PJ in 2050. RPP and NGL demands decrease from 215 PJ in 2010 to 88 PJ in 2050. Biofuel demands increase from less than 0.01 PJ in 2010 to 78 PJ in 2050. Lastly, other fuel demands are minimal.
Industrial: This chart breaks down fuel demand for the industrial sector in the Evolving Policies Scenario. Electricity demand increases from 806 PJ in 2010 to 1014 in 2050. Natural gas demand decreases from 2 202 PJ in 2010 to 1 254 PJ in 2050. RPP and NGL demands decrease from 1 812 PJ in 2010 to 1 418 PJ in 2050. Biofuel demands increase from 419 PJ in 2010 to 1 093 in 2050. Lastly, other fuel demands decline from 171 PJ in 2010 to 56 in 2050.
Transportation: This chart breaks down fuel demand for the transportation sector in the Evolving Policies Scenario. Gasoline demand decreases from 1 416 PJ in 2010 to 386 PJ in 2050. Diesel demand decreases from 819 PJ in 2010 to 218 PJ in 2050. Jet fuel demands increase from 228 PJ in 2010 to 371 PJ in 2050. Biofuel demands increase from 51 PJ in 2010 to 303 in 2050. Other fuel demands increase from 106 PJ in 2010, to 196 in 2050. Hydrogen demand increases from 0.1 PJ in 2021, to 135 in 2050. Lastly, electricity demand increases from 4 PJ in 2010 to 337 in 2050.
Macroeconomic Assumptions and Energy Intensity,
Average Annual Growth Rates 2019 - 2050*
| Real Gross Domestic Product (GDP) | Population | Energy Use Per Person | Energy Use Per $ Real GDP | Fossil Fuel Use Per $ GDP | |
|---|---|---|---|---|---|
| Evolving Policies Scenario | 1.6% | 0.8% | -1.7% | -2.4% | -3.7% |
| Current Policies Scenario | 1.6% | 0.8% | -0.7% | -1.5% | -2.1% |
*2019 instead of 2020 due to the pandemic
- Date modified: