Canada's Energy Future 2021 - Errata
17 May 2022
In reference to corrections for the following document:
Canada’s Energy Future 2021: Energy Supply and Demand Projections to 2050 (EF2021)
- Key Finding #2:
- Updated text: 44% to 47%—Despite total energy use declining, electricity demand grows 47% from 2021 to 2050.
- Figure ES.4: updated electricity usage for hydrogen production from 2021 to 2050.
Click to enlarge
Figure ES.4 Description
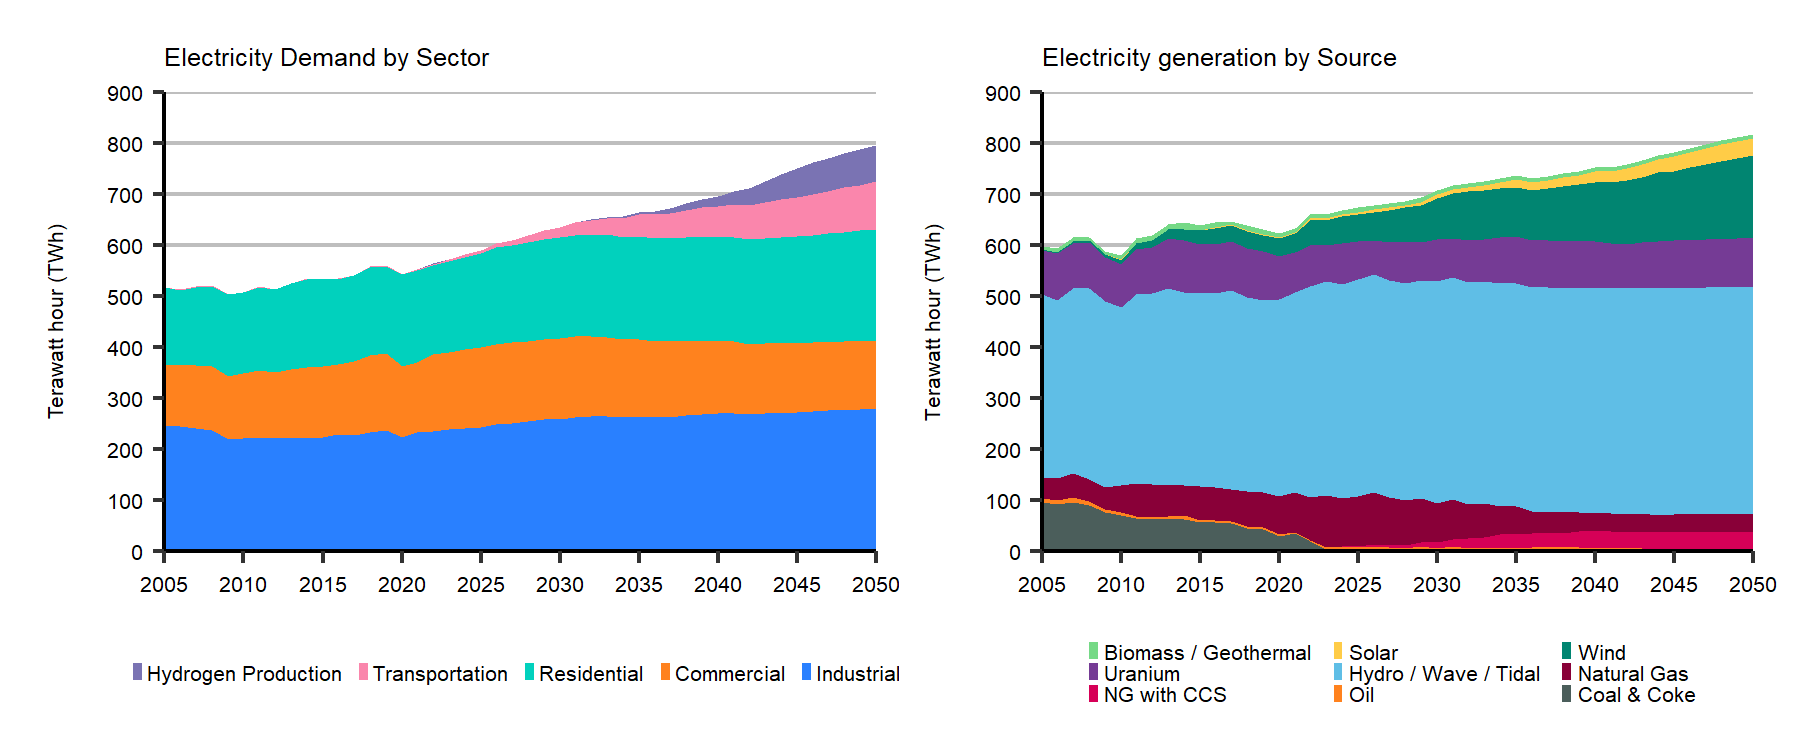
Description: This chart breaks down total electricity demand by sector. Residential demand increases from 171 TWh in 2019 to 217 by 2050. Commercial demand decreases from 150 TWh in 2019 to 134 by 2050. Industrial demand increases from 239 TWh in 2019 to 280 by 2050. Transportation demand increases from 1 TWh in 2019 to 93 by 2050. Hydrogen Production demand increases from 0 TWh in 2019 to 90 TWh by 2050.
Figure ES.5 Description
Description: This chart breaks down total electricity generation by source. Wind generation increases from 32 TWh in 2019 to 159 TWh by 2050. Solar generation increases from 2 TWh in 2019 to 35 TWh by 2050. Natural gas generation decreases from 70 TWh in 2019 to 36 TWh by 2050. Natural gas generation with carbon capture and storage increases from 0 TWh in 2019 to 33 TWh by 2050. Hydro / wave / tidal generation increases from 376 TWh in 2019 to 446 TWh by 2050. Oil generation increases from 4 TWh in 2019 to 6 TWh by 2050. Biomass / geothermal generation decreases from 9 TWh in 2019 to 8 TWh by 2050. Coal and coke generation decreases from 44 TWh in 2019 to 0 TWh by 2050. Uranium generation increases from 95 TWh in 2019 to 96 TWh by 2050.
- Figure ES.4 description: updated 70 TWh to 90 TWh: Hydrogen Production demand increases from 0 TWh in 2019 to 90 TWh by 2050.
- In-text update: updated 44% to 47% and 245 TWh to 263 TWH: Total electricity demand increases by 47% from 2021 to 2050, or by about 263 terawatt hours (TWh).
- Key Finding #7: Figure ES.14 – Y axis unit of measurement changed from petajoules (PJ) to billion cubic feet per day (bcf/d)
Click to enlarge
Figure ES.14 Description
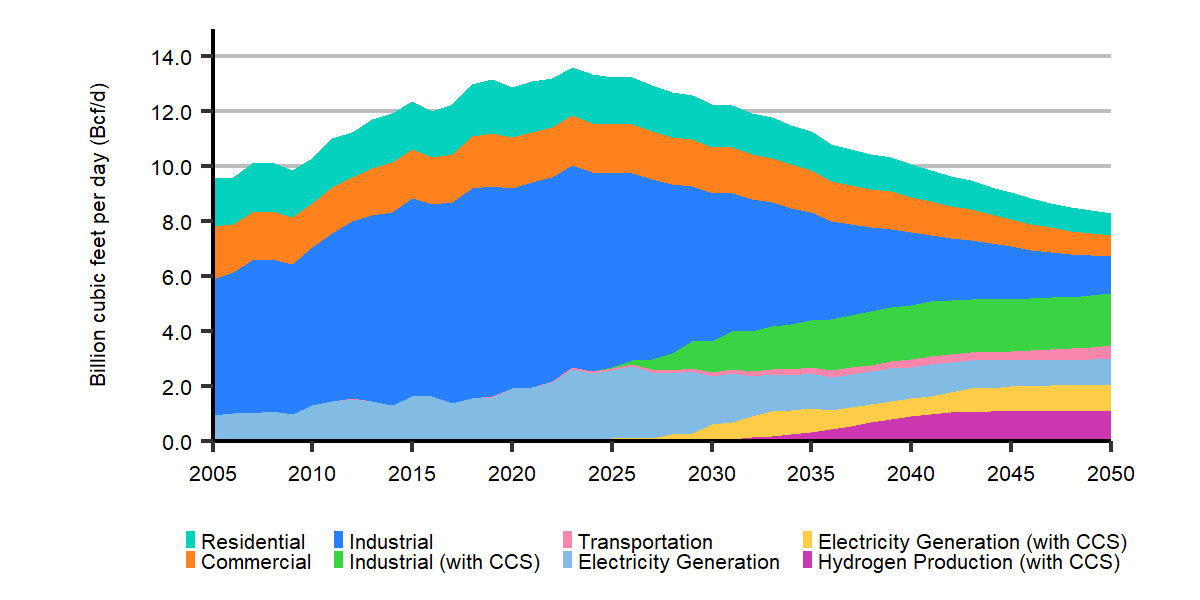
Description: This chart breaks down total natural gas demand by sector for the Evolving Policies Scenario. Residential demand is 1.8 billion cubic feet per day (bcf/d) in 2020, 1.4 bcf/d by 2035, and 0.8 bcf/d by 2050. Industrial demand is 7.3 bcf/d in 2020, 3.8 bcf/d by 2035, and 1.4 bcf/d by 2050. Transportation demand is 0.0 bcf/d in 2020, 0.2 bcf/d by 2035, and 0.5 bcf/d by 2050. Commercial demand is 1.9 bcf/d in 2020, 1.5 bcf/d by 2035, and 0.8 bcf/d by 2050. Electricity generation demand is 1.9 bcf/d in 2020, 1.3 bcf/d by 2035, and 1.0 bcf/d by 2050. Industrial with CCS demand is 0 bcf/d in 2020, 1.7 bcf/d by 2035, and 1.9 bcf/d by 2050. Electricity generation with CCS is 0 bcf/d in 2020, 0.9 bcf/d by 2035, and 0.9 bcf/d by 2050. Hydrogen production with CCS demand is 0 bcf/d in 2020, 0.3 bcf/d by 2035, and 1.1 bcf/d by 2050.
- Results - Electricity
- Figure R.23:
- updated text: 44% to 47%—In the Evolving Policies Scenario, electricity demand grows by 44% from 2021 to 2050.
- Figure R.23: updated electricity usage for hydrogen production from 2021 to 2050.
Click to enlarge
Figure R.23 Description
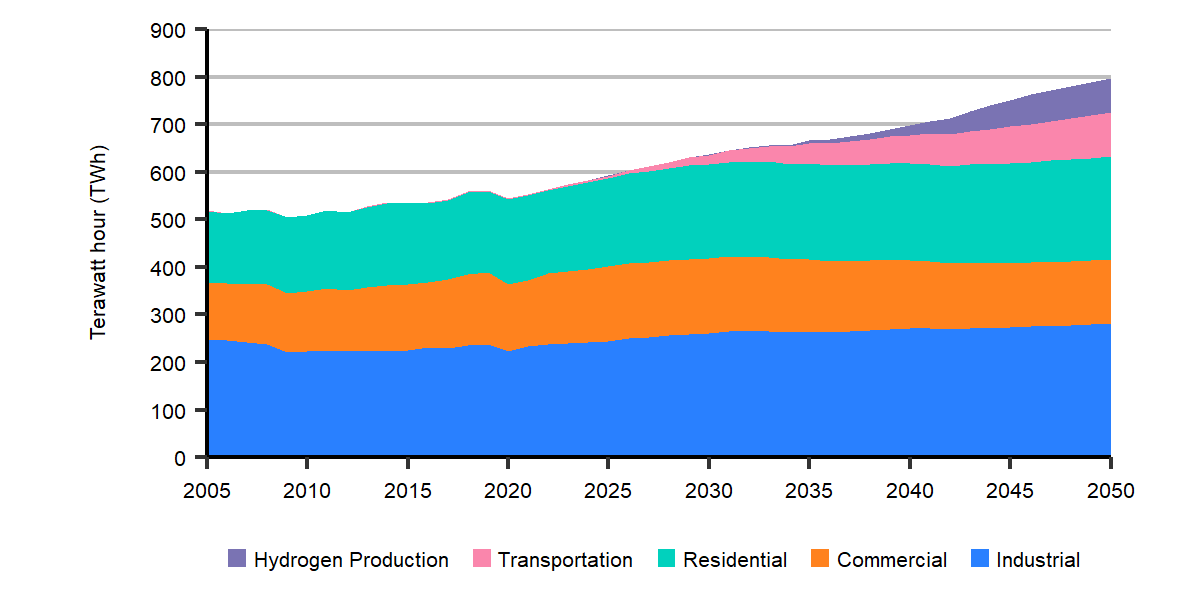
Description: This chart breaks down total electricity demand by sector. From 2019 to 2050, residential electricity demand increases from 171 TWh in 2019 to 223 TWh by 2050. Commercial demand decreases from 150 TWh in 2019 to 134 TWh by 2050. Industrial demand increases from 239 TWh in 2019 to 279 TWh by 2050. Transportation demand increases from 1 TWh in 2019 to 93 TWh by 2050. Hydrogen Production demand increases from 0 TWh in 2019 to 90 TWh by 2050.
- Figure R.25: updated natural gas and oil capacities from 2026 to 2050. Removed 2 100 megawatts (MW) of oil capacity from 2026 to 2050 and added it (2 100 MW of capacity) to natural gas.

Click to enlarge
Figure R.25 Description
Description: This stacked area chart shows electricity generation capacity by fuel type for the Evolving Policies Scenario from 2005 to 2050. Total generation capacity increases from 149 gigawatts (GW) in 2020 to 226 GW in 2050. Biomass and geothermal capacity increase from 2 GW in 2020 to 3 GW in 2050. Solar capacity increases from 3 GW in 2020 to 27 GW in 2050. Wind capacity increases from 14 GW in 2020 to 61 GW in 2050. Uranium capacity decreases from 13 GW in 2020 to 12 GW in 2050. Hydro / wave / tidal capacity increases from 81 GW in 2020 to 86 GW in 2050. Natural gas capacity increases from 24 GW in 2020 to 27 GW in 2050. Natural gas with CCS capacity increases from 0 GW in 2020 to 9 GW in 2050. Oil capacity decreases from 4 GW in 2020 to 4 GW in 2050. Coal and coke capacity decreases from 8.5 GW in 2020 to 0 GW in 2050.
- Figure R.23:
- Results - Hydrogen:
- Updated 60% to 65%: By 2050, the industrial sector accounts for 65% of hydrogen use.
- Updated 15% to 25%: The transportation sector accounts for 25% of hydrogen demand.
- Updated 48% to 54%: Ontario has the highest hydrogen production from electricity, with 54% of Canada’s electrolysis-based total.
- Updated 70 TWh to 90 TWh of electricity: By 2050 close to 90 TWh of electricity is used to produce 1.8 MT of hydrogen.
- Updated 2.95 megatonnes (MT) of hydrogen to 2.69 MT. This correction can be found above Figure R.31.
- Date modified: