Propane Market Review: 2016 Update - Energy Briefing Note
Propane Market Review: 2016 Update - Energy Briefing Note [PDF 1169 KB]
May 2016
Copyright/Permission to Reproduce
Table of contents and list of figures
- Executive Summary
- Introduction
- Canadian Propane Production
- Canadian Propane Exports
- U.S. Propane Production
- U.S. Propane Exports
- Propane Storage in Canada and the U.S.
- Propane Prices
- Seasonal Market Drivers
- Midstream and Downstream Developments
- Future Canadian Propane Market Developments
- Conclusion
1. Executive Summary
The propane market underwent significant changes after winter 2013/14 – best known for the “polar vortex” that dramatically dropped temperatures across much of eastern Canada and the United States (U.S.). Heating fuel prices spiked; in the case of propane, reports of supply shortages in Ontario, Quebec, and the U.S. Midwest attracted significant media and political attention.
In the two years since the polar vortex, prices at major propane hubs have declined to their lowest levels since 2002. Prices at the Edmonton hub fell 90 per cent between February 2014 and February 2015, from 217.9 U.S. cents per gallon to 22.6 U.S. cents per gallon. Over the same time frame, prices at the Sarnia hub fell from 236.9 U.S. cents per gallon to 71.9 U.S. cents per gallon, a 70 per cent decline.
Two extreme market events highlight the volatility of propane prices in the past two years:
- daily spot prices at the Conway hub in Kansas surged above 400 U.S. cents per gallon at the peak of the polar vortex on January 23 and 24, 2014; and,
- prices in Edmonton traded below zero (that is, producers were paying others to take their propane away) by June 2015.
Strong growth in U.S. propane production, underpinned by liquids-rich shale gas development in the U.S. Northeast, and soft seasonal demand have been the driving forces behind low prices throughout the integrated Canada and U.S. propane market.
Propane in underground storage in Canada and the U.S. reached record highs in 2014 and 2015. As of April 2016, U.S. inventories remained significantly above the five-year average, while Canadian inventories are now close to the five-year average.
Western Canadian propane production from gas plants fell slightly in 2015 to 167.8 thousand barrels per day (Mb/d). Exports of propane from Canada were up 24 per cent in 2015, as new rail loading facilities in Alberta helped replace lost export capacity following reversal of the Cochin Pipeline in 2014. Most of these exports have been to the U.S.
U.S. propane exports continue growing as new Gulf Coast export capacity has been constructed to help ship propane from the well-supplied Canada and U.S. market. With exports averaging 615.5 Mb/d in 2015, the U.S. now exports approximately 50 per cent of its propane production.
The propane industry in Canada continues to evolve. This includes midstream developments, such as new rail loading capacity at the Edmonton/Fort Saskatchewan, Alberta hub. In Ontario, the largest residential propane consuming region in Canada, there have been new infrastructure investments in rail offloading terminals and expansions of above-ground storage.
Lastly, despite concerns during winter 2013/14 that prices might remain high and supply low because of structural issues in the propane market, the events of the last two years indicate otherwise.
2. Introduction
In February 2014, the Ministers of Natural Resources and Industry requested that the National Energy Board (NEB or Board) and the Competition Bureau (Bureau) work together to review rapid propane price increases and reports of supply shortages during winter 2013/14.
The Final Report to the Minister of Natural Resources and the Minister of Industry: Propane Market Review (Final Report) was released in April 2014 and had the following conclusions:
- A colder-than-normal winter across the eastern parts of Canada and the U.S. resulted in greater demand for propane to meet home or space heating requirements.
- An exceptionally large and wet corn harvest in the U.S. Midwest resulted in higher-than-normal demand for propane (which is used for crop-drying, particularly corn) prior to the heating season.
- Supply chain congestion and disruptions due to weather and maintenance resulted in less propane being available for delivery and distribution.
- U.S. propane exports had been growing rapidly and this reallocated propane that might have otherwise been available for Canadian and U.S. markets.
- There was no inherent supply-demand imbalance in the propane industry that would create ongoing supply shocks, but propane demand and prices were found to be volatile and unforeseen events would likely cause volatility again.
For the Final Report, the Bureau assessed the structure of the propane market in Canada and performed an independent examination of anti-competitive behaviour in the propane market during winter 2013/14. The Bureau did not find sufficient evidence to conclude that anti-competitive activities exacerbated the impact of the price spike on consumers.
Since the Final Report, the NEB has continued to monitor markets for propane and other natural gas liquids (NGLs). The NEB has also informed Canadians about energy market developments through publications such as weekly Market Snapshots. Propane-related Snapshots were released in November 2014 (Canadian propane market’s recovery from the Polar Vortex), May 2015 (Western Canadian propane inventories at record highs, prices at Edmonton drop to record lows), and January 2016 (Imported value of NGLs surpasses export value in 2015). This update builds on these Snapshots and provides a more comprehensive analysis of the propane market since 2014.
The illustration below (Figure 2.1), taken from the Final Report, shows the structure of the Canadian propane industry. The industry is divided into three segments: upstream, midstream and downstream, and their respective roles within the supply chain are explained.Footnote 1 An understanding of this general industry structure and product flow provides useful context for this update.
Figure 2.1 The Canadian Propane Industry Supply Chain
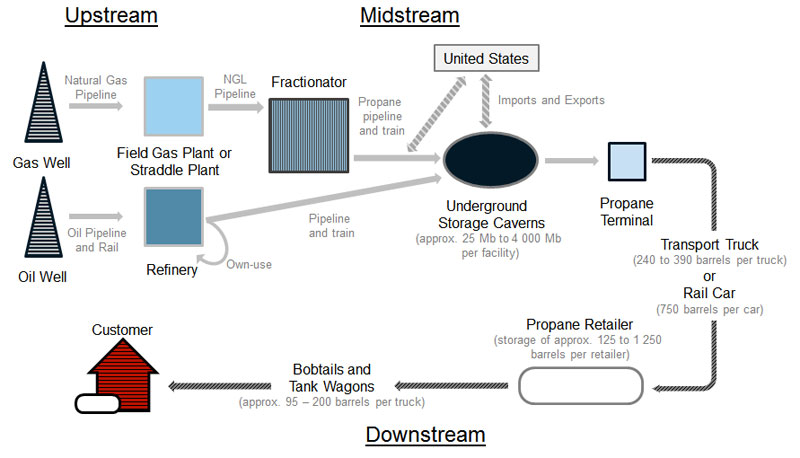
Source: NEB
Description:
This diagram illustrates the propane industry supply chain. Propane is produced from natural gas and as a by-product of oil refining. Propane from natural gas wells is extracted as a stream of natural gas liquids, which are transported by pipeline to a field gas plant or straddle plant, and then transported by a natural gas liquids pipeline to a fractionator. Once propane has been separated from other natural gas liquids by the fractionator, it is transported by a propane pipeline or rail line to either an underground storage cavern in Canada, or to the U.S. for export. Propane from oil wells is based on unrefined oil transported by oil pipelines and rail to a refinery, where the propane is separated from other petroleum products. Once it has been separated, propane is either used for that refinery’s own use, or is transported by pipeline or rail line to underground storage caverns in Canada. Propane can also be imported from the U.S. via propane pipelines and rail for storage in underground caverns. Storage caverns in Canada have capacities ranging from 25 thousand barrels to 4 million barrels. Propane is extracted from storage caverns via propane terminals, and then shipped by truck or rail to propane retailers. Propane transport trucks have a capacity of 240 to 390 barrels, and propane rail cars have a capacity of approximately 750 barrels. Propane retailers then store the propane in tanks with a capacity of 125 to 1 250 barrels per retailer, and use bobtails and tank wagons, which have a capacity of between 95 to 200 barrels, to deliver propane to end customers. Activities involving extraction and processing of propane are typically referred to as “upstream” activities, whereas storage and transportation are considered “midstream”, and end delivery is “downstream”.
3. Canadian Propane Production
The vast majority of Canadian propane is produced by gas plants in western Canada.Footnote 2 Western Canadian gas plant production of propane has been trending upwards since 2010, primarily due to growing development of the liquids-rich Montney formation of northeast British Columbia (B.C.) and the Alberta Deep Basin. In 2014, western Canadian gas plant production of propane reached a 10-year high, averaging 173.9 Mb/d, or 8.1 per cent higher than 2013 (Figure 3.1). Gas plant propane production fell by 1.2 per cent in 2015 to 171.7 Mb/d.
Figure 3.1 Western Canadian Propane Production from Gas Plants
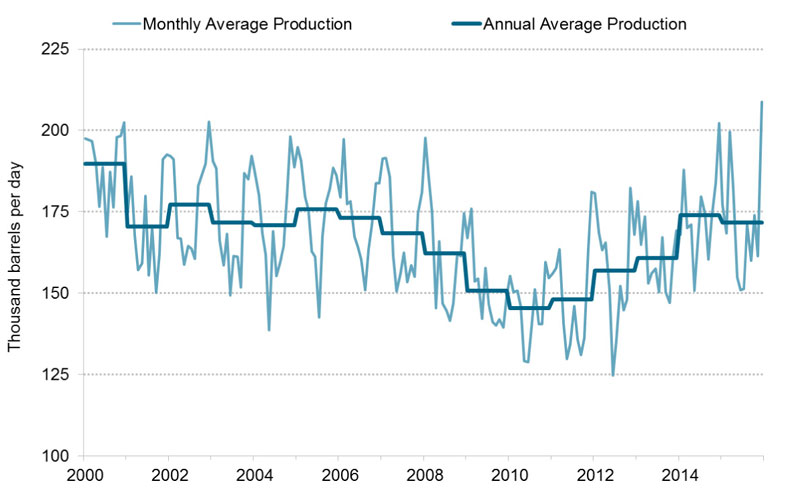
Source: Provincial governments and NEB
Description:
This line graph illustrates monthly production of propane from western Canadian gas plants and the annual average production of propane from 2000 to 2014. Though western Canada propane production has generally declined since 2000, the trend has generally reversed in recent years, with production growing from 145.5 thousand barrels per day in 2010 to 171.7 thousand barrels per day in 2015.
Propane production generally follows the trend of natural gas production. The trend of declining natural gas production in western Canada reversed in 2012, with 2015 gas production increasing 2.5 per cent from 2014 (Figure 3.2). The small decline in propane production in 2015, despite the increase in gas production, could be due to weak propane pricesFootnote 3 and some gas plants choosing to reduce recovery of propane (and other liquids) or re-inject propane into the gas stream.Footnote 4,Footnote 5
Figure 3.2 Western Canadian Propane and Natural Gas Production
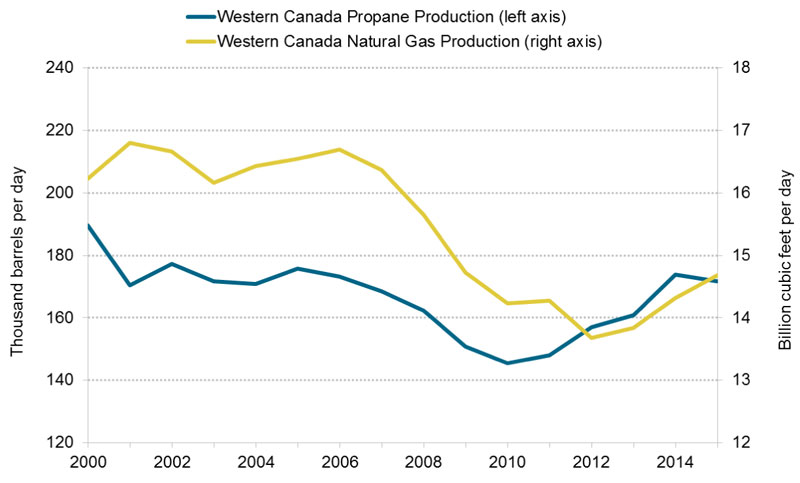
Source: Provincial governments and NEB
Description:
This line graph illustrates the relationship between annual western Canadian natural gas production and annual western Canadian propane production from natural gas processing plants between 2000 and 2014. Western Canadian natural gas production has generally declined between 2001 and 2012, from 16.8 billion cubic feet per day in 2001 to 13.7 billion cubic feet per day in 2012. By 2015, western Canadian gas production had rebounded to 14.7 billion cubic feet per day. Western Canadian propane production from gas processing plants has generally declined from 2000 to 2010, from 190 thousand barrels per day to 145 thousand barrels per day. However, by 2015, propane production rebounded to 172 thousand barrels per day.
4. Canadian Propane Exports
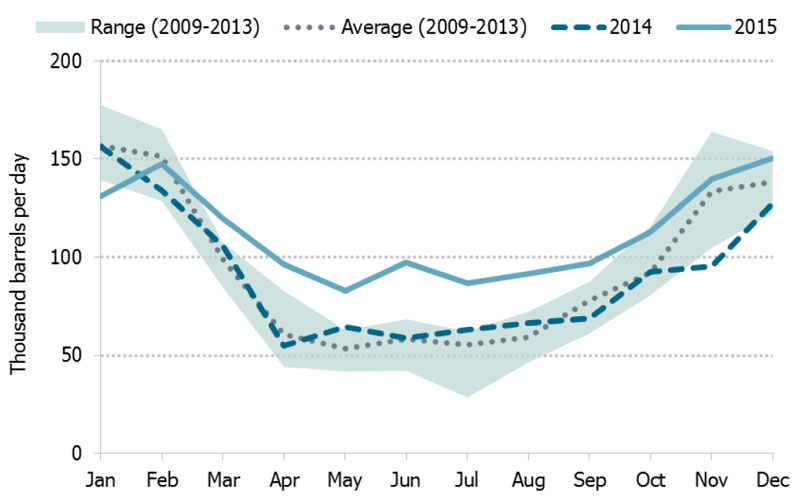
Canadian propane exports increased by 20 per cent in 2015 to 112.5 Mb/d.Footnote 6 In 2015, exports were higher than the five-year average for all months after February, particularly in the summer months (Figure 4.1). Low prices at Edmonton relative to markets elsewhere in North America, and new propane rail loading capacity that facilitated exports, were contributing factors to this export growth.
Figure 4.1 Canadian Exports of Propane by Month
Source: NEB
Description:
This graph illustrates Canadian exports of propane by month for 2014 and 2015, and plots them with the five-year range and five-year average from 2009-2013. Canadian propane exports to the U.S. are highly seasonal, peaking in the high-demand winter months between 125 and 175 thousand barrels per day. Exports in 2014 were mostly within the five-year range and close to the five-year range, except in November when exports were 29 per cent below the five-year average. In 2015, exports were outside of the five-year range from March to September. Exports returned to the five-year range but were above the five-year average from October to December.
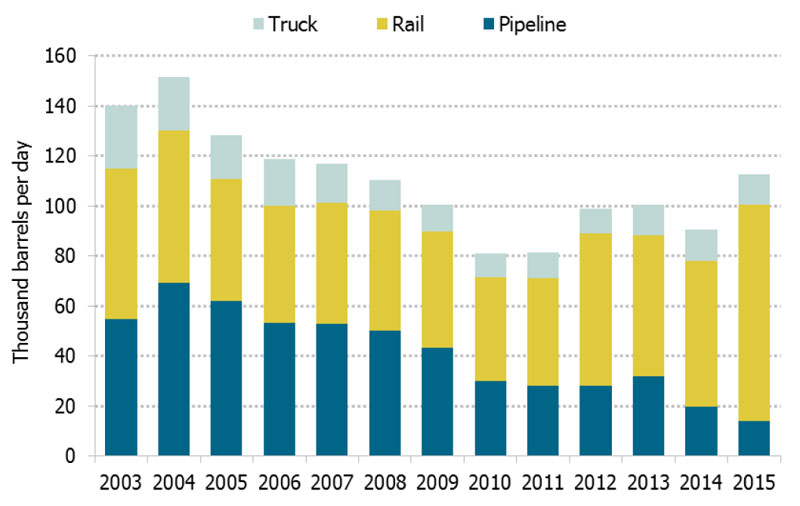
Reversal of the Cochin PipelineFootnote 7 in 2014 accentuated an ongoing shift of pipeline to rail transport for Canadian propane exports to the U.S., which is Canada’s primary propane export market.Footnote 8 Pipeline exports have shrunk to only 14.0 Mb/d, while rail moved an average 86.6 Mb/d of propane to the U.S. (Figure 4.2). In 2005, rail moved roughly 38 per cent of propane exports but in 2015, rail moved 77 per cent. The share of truck exports remained steady at around 11 per cent. Truck is only economical when moving propane short distances and is most common in Ontario and Quebec.
Figure 4.2 Canadian Exports of Propane by Transportation Mode
Source: NEB
Description:
This graph illustrates the annual volumes of propane exported from Canada in thousand barrels per day between 2003 and 2015. Generally speaking, exports decreased from 2003 to 2010, and then rebounded from 2011 to 2015. The graph also shows the mode of transportation for export - truck, rail and pipeline. The role of pipelines in exporting propane has been gradually declining, while the role of rail has been increasing. In 2015, total propane exports were 112.5 thousand barrels per day and the split between rail, pipeline, and truck was 77 per cent, 12 per cent, and 11 per cent respectively.
Currently, the only specification propaneFootnote 9 pipeline delivering propane out of Alberta is Spectra’s PTC Pipeline. PTC has a capacity of 15 Mb/d and runs from Empress, Alberta to Fort Whyte, Manitoba and also delivers propane to truck and rail terminals in Saskatchewan and Manitoba. In addition to supplying propane to the prairies, these truck and rail terminals facilitate exports to the U.S. Midwest.
Pipelines from western Canada that deliver non-specification propane include Enbridge’s Lines 1 and 5, and the Alliance Pipeline. Enbridge Line 1 delivers propane-plusFootnote 10 mix from Fort Saskatchewan, Alberta to Superior, Wisconsin while Line 5 delivers propane-plus mix from Superior to storage caverns and the Plains Midstream fractionator in Sarnia, Ontario.
The Alliance Pipeline delivers a liquids-rich, minimally processed stream of natural gas from western Canada directly to Aux Sable’s natural gas processing facility in Channahon, Illinois. While natural gas volumes on Alliance have remained steady at around 1.5 to 1.6 billion cubic feet per day, the volume of liquids (as shown by the heat content of the gas stream) has been increasing in recent years.Footnote 11 Exports of natural gas liquids on Alliance are not tracked by the NEB as they are considered part of the natural gas stream.
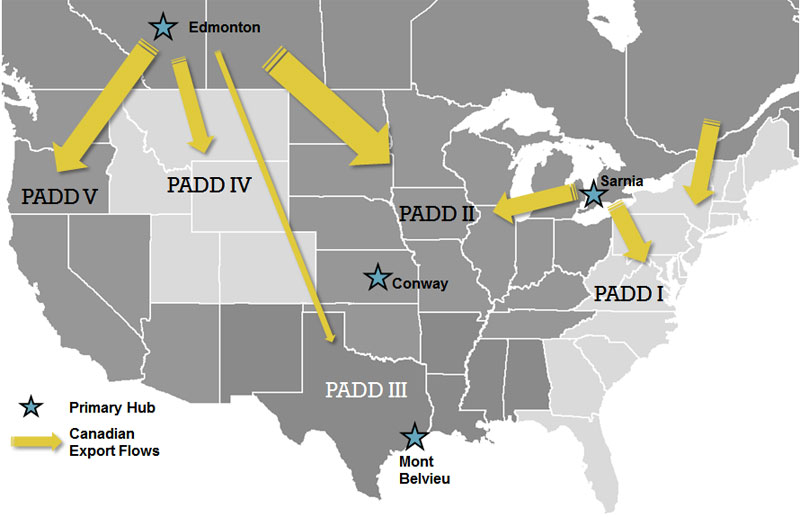
Exports of Canadian hydrocarbons to the U.S. are tracked by PADD (Figure 4.3).Footnote 12 The U.S. destinations for Canadian propane exports changed slightly in 2015, particularly with respect to exports to the West Coast (PADD V). From 2009 to 2014, roughly 14 per cent of Canadian propane exports were delivered to PADD V. By the second half of 2015, the percentage of propane exports to PADD V had more than doubled to 29 per cent. The addition of propane export capabilities at the Petrogas facility in Ferndale, Washington is likely the reason for this leap in Canadian propane exports to PADD V. Petrogas is exporting approximately 35 Mb/d of propane and butanes. Currently, all propane exported from Canada to the U.S. by Petrogas is under short-term order.
Figure 4.3 Map of Propane Pricing Hubs and Canadian Export Flows to U.S. PADDs
Sources: EnCana, EV Maps, NEB
Description:
This map illustrates the primary propane hubs in North America: Mont Belvieu, Texas; Conway, Kansas; Edmonton, Alberta; and Sarnia, Ontario. This map also illustrates the location of the five U.S. PADDs, and features arrows to show approximate propane export flows from Canada to the U.S. PADDs. The majority of Canadian propane exports in 2015 were to PADD I (East Coast), II (Midwest) and V (West Coast).
5. U.S. Propane Production
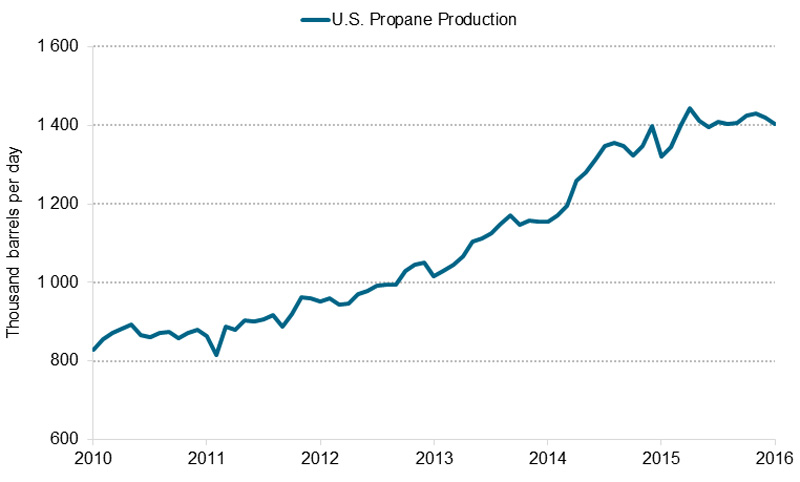
Driven by ongoing development of U.S. shale gas, propane production in the U.S. continued to grow, from an annual average of 1.3 million barrels per day (MMb/d) in 2014 to 1.4 MMb/d in 2015 (Figure 5.1). This growth is based largely on a surge in production during the first half of 2014. Since then production has fluctuated and then flattened.
Figure 5.1 U.S. Propane Production (Gas Plants and Refineries)
Source: EIA
Description:
This graph illustrates monthly U.S. propane production from gas plants and refineries from January 2010 to January 2016. U.S. propane production has grown from an average 867 thousand barrels per day in 2010 to an average 1.4 million barrels per day in 2015.
The slowdown in U.S. propane production growth can be attributed to low NGL prices as well as a slowdown in natural gas production growth. U.S. dry gas production grew 5.3 per cent in 2015 versus 6.3 per cent in 2014. Preliminary indicators suggest that U.S. natural gas production may be flattening or even declining in response to low natural gas prices.
6. U.S. Propane Exports
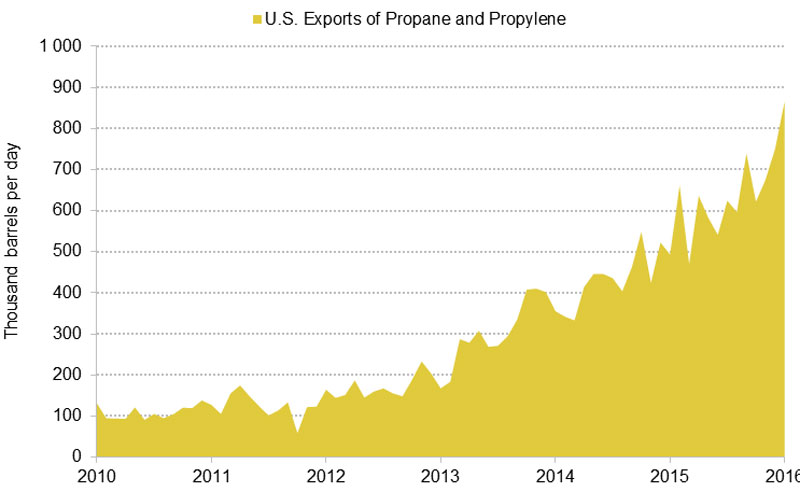
The development of new export capacityFootnote 13 in the U.S. Gulf Coast since winter 2013/14 has contributed to continued strong U.S. export growth. Propane exports in 2015 averaged 616.2 Mb/d, more than double the average of 301.1 Mb/d reported in 2013 (Figure 6.1). Approximately 50 per cent of U.S. propane production is now being exported.
Figure 6.1 U.S. Exports of Propane and PropyleneFootnote 14
Source: EIA
Description:
This graph illustrates monthly U.S. propane exports from 2010 to 2015. U.S. propane exports have grown from an average 109 thousand barrels per day in 2010 to an average 616 thousand barrels per day in 2015.
Propane is also being exported from the U.S. West Coast. The Petrogas export facility in Ferndale, Washington started exporting propane to Asian markets following the completion of an expansion in April 2015. Previously, the Petrogas facility had exported only butanes.
Asia has been a significant market for U.S. propane exports, particularly in 2015, when exports to Asia tripled from 2014 levels.Footnote 15 The Asian market now accounts for roughly a third of U.S. propane exports. U.S. propane deliveries to other markets such as Europe, South America, Mexico, the Caribbean, and Central America, have only grown slightly since 2014.
7. Propane Storage in Canada and the U.S.
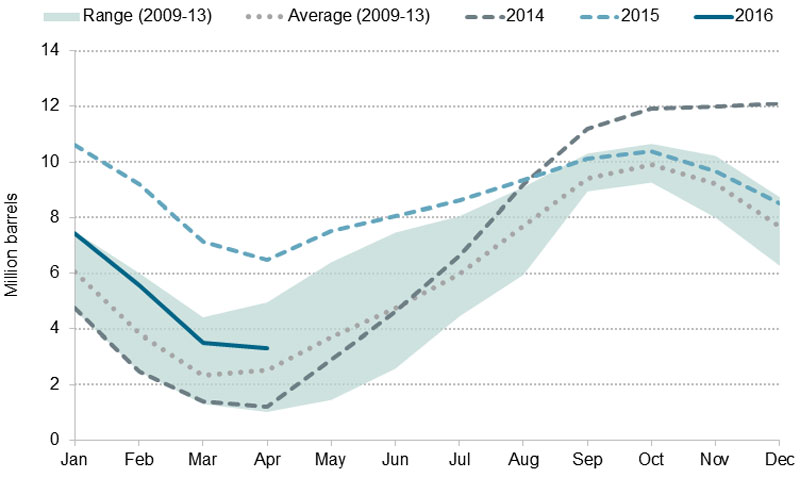
Underground storage of propane in Canada and the U.S. remains high following winter 2013/14 due to strong supply, weak demand, and a more cautious downstream propane industry. Canadian propane inventories remained high between August 2014 and August 2015, primarily due to reversal of the Cochin Pipeline, strong U.S. production growth that displaced demand for Canadian propane, and a less severe 2014/15 winter. (Figure 7.1)
Figure 7.1 Underground Storage of Propane in Canada
Source: NEB
Description:
This graph illustrates monthly underground volumes of propane in storage in Canada in 2014, 2015, and 2016. These storage volumes are compared with the five-year average and five-year range from 2009 to 2013. Storage volumes accumulate in the warmer summer months, and decline in the colder winter months. Storage volumes rose above the five-year range in September 2014 and remained above the five-year range until September 2015. In 2016, storage volumes remained at the high end of the five-year range, but as of April 2016, have declined closer to the five-year average.
In Canada, propane inventories reached a record high of 12.1 MMb in December 2014. The bulk of this storage was in western Canada, where inventories stood at 6.8 MMb – 42 per cent above the previous five-year average for December. By October 2015, the storage overhang had disappeared due to the addition of new rail loading capacity for propane in western Canada, and Canadian inventories returned to the five-year average (2009-2013). In April 2016, Canadian inventories were reported at 3.3 MMb, 32 per cent above the five-year average (2009-2013), but well within the five-year range.
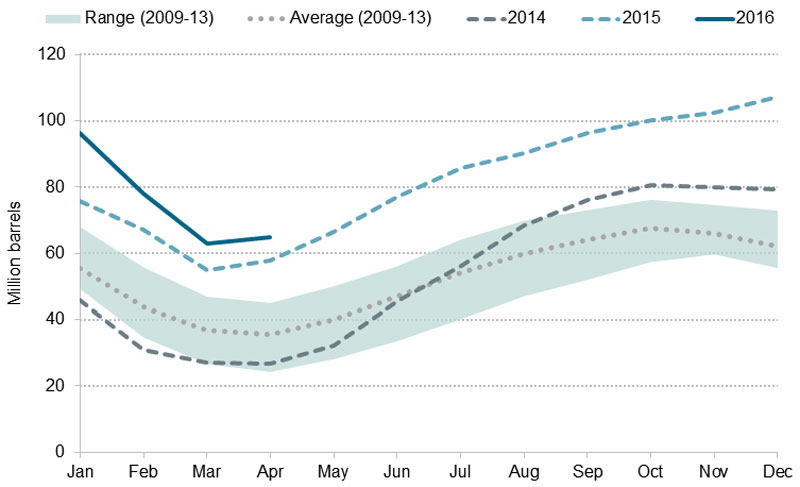
U.S. propane inventories rebounded strongly following substantial withdrawals made during winter 2013/14, reaching levels far above the five-year average (2009-2013) for winter of 2014/15 (Figure 7.2). Following a seasonal withdrawal ending in March, inventories resumed rapid growth. By December 2015, U.S. inventories reached a record high of 107.1 MMb. As of early April 2016, total U.S. inventories were at 64.9 MMb – approximately 82 per cent above the five-year average.
Figure 7.2 Underground Storage of Propane in the U.S.
Source: EIA
Description:
This graph illustrates monthly underground volumes of propane in storage in the U.S. in 2014, 2015, and 2016. These storage volumes are compared with the five-year average and five-year range from 2009 to 2013. Storage volumes accumulate in the warmer summer months, and decline in the colder winter months. Storage volumes rose above the five-year range in September 2014 and remained at record highs for most of 2015. Record high storage volumes in the U.S. continued into 2016, even after a large winter storage withdrawal of 44 million barrels between December 2015 and March 2016.
The majority of U.S. underground storage capacity is in the Gulf Coast. This is also where the bulk of the current storage surplus resides. Since January 2015, Gulf Coast storage has averaged 88 per cent above the five-year average (2009-2013). However, that storage surplus has been shrinking quickly in 2016 as U.S. export growth has been drawing down propane inventories at a rapid pace.
8. Propane Prices
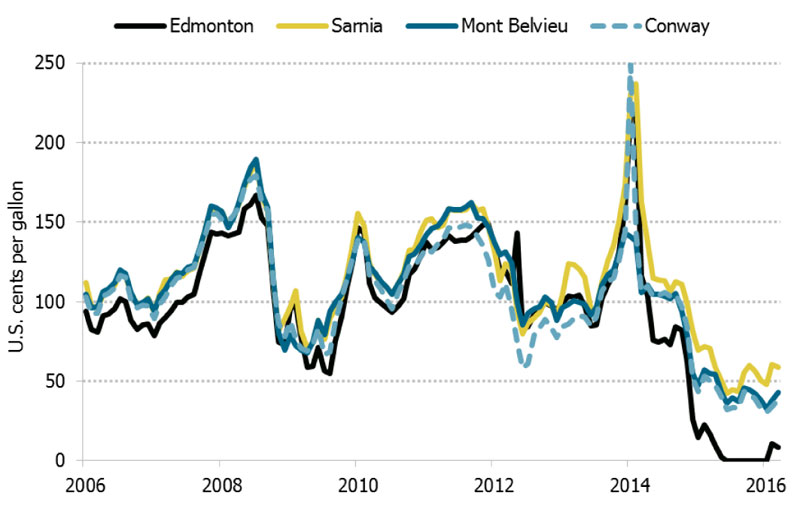
Major North American pricing and storage hubs for propane include: Edmonton, Alberta; Sarnia, Ontario; Conway, Kansas; and Mont Belvieu, Texas (Figure 4.3). Prices at these hubs tend to move in tandem with each other, although regional differences do exist. For example, Edmonton generally trades at a discount to all the other hubs, reflecting ample supplies and high transportation costs to move propane out of the Edmonton/Fort Saskatchewan area.
Following winter 2013/14, propane prices at all North American hubs have been on the decline (Figure 8.1). In Edmonton, after prices reached highs of 217.9 U.S. cents per gallon in February 2014, prices declined to 22.6 U.S. cents per gallon in February 2015 – a 90 per cent decline. Similarly in Sarnia, prices declined from 236.9 U.S. cents per gallon in February 2014 to 71.9 U.S. cents per gallon in February 2015 – a 70 per cent decline. By February 2016, prices declined further to average 10.9 U.S. cents per gallon and 60.3 U.S. cents per gallon respectively, at Edmonton and Sarnia.
Figure 8.1 Wholesale Propane Prices at Major Hubs in the U.S. and Canada
Sources: Butane-Propane News, NEB calculations
Description:
This graph illustrates monthly average propane prices in U.S. cents per gallon for four major hubs in North America: Edmonton, Sarnia, Mont Belvieu, and Conway. Generally, the wholesale price of propane at North American hubs track each other, including a major spike during winter 2013/2014. Since then, prices at all the hubs have dropped sharply. Also, Edmonton prices have detached from the other pricing hubs since mid-2014 and fell to record lows in 2015.
From January 2015 to July 2015, underground propane inventories in western Canada were at a record high due to the winter 2014/15 storage hangover. The resulting storage surplus in Edmonton (and elsewhere in North America) combined with tight takeaway capacity led to Edmonton prices going negative in June 2015 (that is, producers paying others to take their propane away).
Inventories in western Canada fell more in-line with the five-year average (2009-2013) by November 2015, following a summer of high exports. However, Edmonton prices remain the lowest in North America heading into 2016. Sellers of propane in Edmonton had to offer substantial discounts in order to remain competitive in the well-supplied U.S. market.
Retail propane pricesFootnote 16 in Canada generally track wholesale propane prices (Figure 8.2), with both declining in the two years following winter 2013/14. In 2015, the Canadian average for retail (automotive) propane averaged 59.1 cents per litre (including taxes), down 25 per cent from the 2014 average of 78.8 cents per litre.Footnote 17 Generally speaking, there has been little media coverage of retail propane price issues since winter 2013/14.
Figure 8.2 Retail (Automotive) and Wholesale Canadian Propane Prices
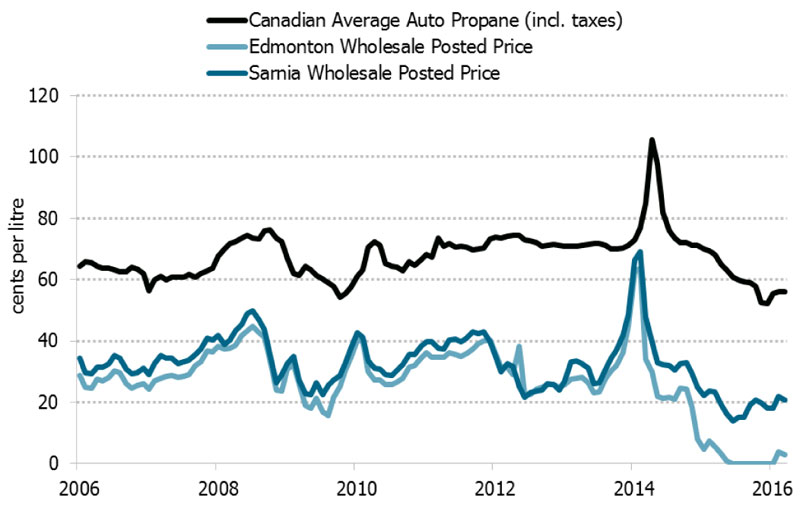
Sources: Kent Marketing Services, Butane-Propane News, NEB calculations
Description:
This graph illustrates monthly Canadian average automotive propane prices and their relationship with Canadian wholesale propane prices in Edmonton and Sarnia. Wholesale and retail prices track closely, and following the price spike in January and February 2014, both wholesale and retail prices have generally declined. Also, Edmonton prices have detached from Sarnia prices since mid-2014 and fell to record lows in 2015.
9. Seasonal Market Drivers
Seasonal factors can have significant effects on propane markets, particularly when those effects fall outside the range of “normal” or expected outcomes. Just as extreme cold conditions and high agricultural demand can cause heating fuel prices to spike, as they did in winter 2013/14, unexpectedly warm weather during the heating season and ideal harvest conditions, as observed in the subsequent two years, can cause prices to fall. This is reflected in the price fluctuations shown in Figure 8.1 and Figure 8.2.
Canada and the U.S. have not seen a repeat of the extreme polar vortex witnessed in winter 2013/14. For the most part, the warmer 2014/15 and 2015/16 winters resulted in less winter consumption of propane, and higher inventories following the heating season.
Despite high U.S. corn harvests in 2014 and 2015 (14.2 billion and 13.6 billion bushels, respectively), crop drying demand for propane was lower than it was in 2013. U.S. Midwest propane inventories during the crop drying season from early October 2013 to early January 2014 declined 48 per cent. This significant inventory decline aggravated supply issues during the polar vortex. By comparison, U.S. Midwest propane inventories declined only six per cent from early October 2014 to early January 2015 and seven per cent from early October 2015 to early January 2016.
10. Midstream and Downstream Developments
Western Canada
The Cochin Pipeline stopped receiving propane at the end of March 2014 and was operating in condensate import service for the oil sands diluent market by July 2014. Prior to this reversal, when the line was flowing propane from Alberta to the U.S. Midwest and Ontario, Cochin’s average utilization between 2012 and 2014 was 45 per cent (approximately 32 Mb/d). Now that Cochin delivers condensate to the Alberta oil sands, its utilization averages 85 per cent (approximately 80 Mb/d).
The reversal of Cochin has placed greater emphasis on using rail to transport Canadian propane to market. Also, whereas Cochin primarily served the U.S. Midwest and Ontario markets, propane moved by rail can access markets across Canada and the U.S.
Keyera’s Josephburg rail terminal near Fort Saskatchewan, Alberta was completed in July 2015. The terminal has a loading capacity of 40 Mb/d and has the flexibility to handle butanes in addition to propane. Keyera also has plans to add 35 Mb/d of propane-plus fractionationFootnote 18 capacity at its Fort Saskatchewan facility, with an anticipated completion date at the end of the second quarter of 2016.
Plains Midstream Canada commenced Phase II of its Fort Saskatchewan Facility Expansion in late 2014. The expansion will include construction of a loading terminal with capacity of 60 rail cars per day (approximately 45 Mb/d). The expansion also involves debottlenecking of the Plains fractionator, increasing inlet capacity from 65 Mb/d to 85 Mb/d, and development of three new underground natural gas liquids storage caverns with capacity of 2.2 MMb.
Pembina’s RFS II project involves expansion of the Redwater Fractionator and Storage facility in Redwater, Alberta (north of Edmonton). The project includes a 73 Mb/d ethane-plus fractionator and is scheduled for completion in the first quarter of 2016. The RFS III project, scheduled for late 2017, will involve construction of a third fractionator to process 55 Mb/d of propane-plus mix. Ongoing cavern development at Redwater has also increased propane storage capacity since 2014.
Ontario and Eastern Canada
Ontario is the largest residential propane consuming region in Canada. Following issues encountered during winter 2013/14, infrastructure investments were made to improve the receipt and delivery of propane. NGL Supply’s Putnam Terminal in Dorchester, Ontario started operations in August 2015 with rail offloading capabilities and 60 thousand U.S. gallons of storage (1 430 barrels). In October 2015, Factor Gas Liquids, in partnership with Dowler Karn, established the St. Thomas Propane Terminal in southwestern Ontario. The terminal is capable of unloading six rail cars per day into a 90 thousand U.S. gallons (2 145 barrels) storage tank, and loading a 405 barrel capacity Super B truck in 25 to 30 minutes.
In addition, retailers have also invested in above-ground storage. Stinson and Sons expanded storage capabilities in Arnprior, Ontario in 2015. Budget Propane is planning to double storage capacity in Cornwall, Ontario in 2016. In Winchester, Ontario, Guy Fuels is installing 30 thousand U.S. gallons (714 barrels) of storage. To improve retail delivery efficiency, Parkland and Superior Propane implemented new truck routing systems.
Midstream companies in Ontario have also made trucking upgrades, including a new truck loading rack at Pembina’s Corunna storage facility in early 2016, and a re-commissioned truck loading rack at Imperial Oil’s Sarnia facility in the fall of 2015.
Lastly, in eastern Canada, a new terminal operated by Wilsons with rail offloading and truck loading started operation in Moncton, New Brunswick. The Wilsons terminal also includes 120 thousand U.S. gallons (2 860 barrels) of storage capacity.
11. Future Canadian Propane Market Developments
Propane Demand in Alberta
In February 2016, the Alberta government launched the Petrochemicals Diversification Program.Footnote 19 The program offers $500 million in royalty credits to select petrochemical facilities that apply through a competitive process. As petrochemical facilities cannot benefit directly from royalty credits because they do not pay royalties, the credits would be traded or sold to an oil or natural gas producer who would then use the credits to reduce royalty payments to the Alberta government. The program targets the value-added use of methane and propane with the goal of attracting $3-5 billion of investment in energy processing to Alberta.
Williams’ continues to move ahead with its proposed propane dehydrogenation (PDH) unit in Fort Saskatchewan, Alberta. The PDH unit would consume approximately 20 Mb/d of western Canadian propane and produce propylene. An off-take agreement for the propylene was signed in 2015 with North American Polypropylene. A final investment decision is planned for late 2016, with operational start-up planned for 2019.
Long-Term Propane Exports
Three long-term Canadian propane export projects are currently proposed by Pembina, AltaGas, and Petrogas Energy Corp. The AltaGas and Petrogras propane export licence applications are currently before the Board, and this propane market update does not provide an indication about whether these applications will be approved or not.
In November 2015, the Board approved Pembina’s application to export up to 75 Mb/d of propane from Canada for a period of 25 years. The export facility was planned for Portland, Oregon. However, in February 2016, Pembina decided that it would no longer pursue the Portland location and will now evaluate other sites on the West Coast.Footnote 20
In February 2016, AltaGas applied to the Board for a 25 year licence to export up to 46 Mb/d of propane from a terminal located in Prince Rupert, B.C.Footnote 21 Propane would be shipped to the terminal by rail. AltaGas has stated that if it receives all required regulatory approvals, AltaGas expects to reach a final investment decision later in 2016 with first exports targeted for 2018.Footnote 22
Lastly, in March 2016, Petrogas Energy Corp. applied to the Board for a 25 year licence to export up to 107 Mb/d of propane from Canada.Footnote 23 Petrogas currently operates a propane storage, distribution, and export facility in Ferndale, Washington.
Canada’s Energy Future 2016
In January 2016, the NEB released Canada’s Energy Future 2016, its latest long-term energy outlook. The report’s Reference CaseFootnote 24 assumes propane production in Canada gradually grows until 2040 due to increasing development of liquids-rich natural gas in the Montney and Alberta Deep Basin formations.
12. Conclusion
The propane market in Canada and the U.S. has undergone substantial changes since 2014. While some trends noted in the Final Report continue, especially strong growth in U.S. propane production and U.S. exports, other circumstances have changed. High production and storage, coupled with weak seasonal demand, caused wholesale propane prices to decline to 14-year lows at most hubs, and record lows in Edmonton. Retail propane prices have also declined.
This decline in prices supports the Final Report’s conclusion (Section 8.4) that:
- ... price increases and initial local shortages are not indicative of long-term supply-demand imbalances in the Canadian propane industry. Short-term propane prices have historically been volatile due to the industry’s traditional combination of steady supply, fluctuating demand, and complex logistics. While there is sufficient production, storage, and transportation infrastructure to meet the future needs of Canadians, utilization of this infrastructure throughout the year is often based on market expectations of variables such as weather. Accordingly, temporary price spikes and shortages are likely in the future. No other factors are expected to exacerbate these challenges or contribute to future shortages and price increases.
In other words, despite concerns during winter 2013/14 that prices might remain high and supply low because of structural issues in the propane market, the events of the last two years indicate otherwise. Furthermore, these events illustrate that the propane market can bmovemente highly volatile in multiple ways, with prices and supply potentially having large fluctuations in both directions.
The Canadian propane industry appears to have become more cautious in response to the 2013/14 polar vortex-driven price spike. Midstream and downstream companies have made (and are continuing to make) investments in transportation infrastructure to facilitate of propane from producing regions and storage facilities to distribution terminals and consumers. The Canadian propane industry is also looking for new markets and sources of demand.
The Board remains committed to monitoring propane market developments and keeping Canadians informed about these developments through Market Snapshots, price updates, and publications such as this update.
- Date modified: