ARCHIVED – Canadian Energy Dynamics: Highlights of 2015 - Energy Market Analysis
This page has been archived on the Web
Information identified as archived is provided for reference, research or recordkeeping purposes. It is not subject to the Government of Canada Web Standards and has not been altered or updated since it was archived. Please contact us to request a format other than those available.
February 2016
Canadian Energy Dynamics: Highlights of 2015 - Energy Market Analysis [PDF 16171 KB]
ISSN 2292-8308
Copyright/Permission to Reproduce
Table of Contents

- Overview of 2015
- Statistical Highlights
- Energy Consumption in Canada
- Crude Oil: Global Developments
- Crude Oil: Western Canada
- Crude Oil: Other Canadian Regions
- Natural Gas Liquids
- Canadian Gasoline Prices
- Natural Gas: North American Trends
- Natural Gas: Canadian Production
- Liquefied Natural Gas
- Electricity: Traditional Sources
- Electricity: Renewable Generation
- GHG Emissions
- Appendix A: Acronyms and Units
- Appendix B: Data Sources
- Appendix C: About the NEB

Photo: A solar farm in Ontario.
Overview of 2015
Dynamic changes in supply, demand, and infrastructure continually shape Canada’s energy sector. The National Energy Board (NEB or Board) actively monitors these changes and produces independent, fact-based energy information to increase the transparency of energy markets and support energy literacy. This publication, Canadian Energy Dynamics: Highlights of 2015, is a brief and easy-to-read report designed to support these goals.
Canada experienced slower economic growth in 2015, with negative gross domestic product (GDP) growth in the first half of the year and a modest rebound in the second half. Energy use growth is expected to slow in 2015 due to job losses and production curtailments in natural resource sectors.
The crude oil price decline that started in 2014 intensified in 2015, with the price of West Texas Intermediate (WTI) reaching a six-year low of US$35 per barrel in December 2015. Despite the slide in crude oil prices, western Canadian oil production reached a record high of 3.85 million barrels per day (MMb/d) in February 2015. As a result of forest fires and facility shutdowns in Alberta, annual production growth slowed to 0.13 MMb/d. Production growth in the United States (U.S.) also slowed in 2015, and expectations for future supply growth in the U.S. have decreased due to the low oil price environment.
The decline in crude oil prices, combined with strong liquids-rich gas production in the U.S., contributed to lower natural gas liquids prices. With seasonal heating demand failing to materialize during the 2014/15 winter, underground propane inventories in western Canada and the U.S. rapidly increased, resulting in negative propane prices at the Edmonton hub in June.
Gasoline prices in Canada and the U.S. climbed steadily over the summer months due to high gasoline demand and refinery outages. As refineries returned to operation and as demand waned at the end of the summer driving season, gasoline prices declined towards the end of 2015.
Natural gas from the Marcellus and Utica Shales in the U.S. continued to displace Canadian exports to the U.S. New pipeline projects have been proposed in Ontario to bring U.S. gas into eastern Canada and further displace western Canadian natural gas in that market.
No Canadian liquefied natural gas (LNG) export projects started construction in 2015. With LNG prices falling in conjunction with crude oil prices, and several new U.S. LNG projects either completed or under construction, Canadian LNG projects face an increasingly challenging business environment.
Low wholesale electricity prices continued in 2015 as annual average prices in Alberta and Ontario fell to the lowest levels since the two markets were deregulated. New supply and slowing demand growth were the driving factors in the decline in annual average prices. With respect to renewables, capacity additions continued in 2015, but at a slower rate. Soft electricity demand, lower prices, and changing incentives were factors behind the slowdown in capacity growth.
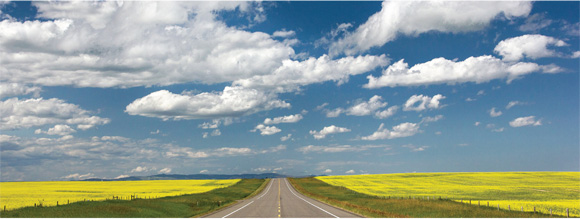
Photo: A road going through a canola field.
Statistical Highlights
Statistical Highlights

* Some annual statistics quoted in this report include estimates for one or more months of 2015 data.
Text version of this graph
Source: NEB
Description:
- 48% Decline in price of WTI crude oil - 2015 versus 2014
- Canadian solar capacity in 2015 - Up 11% from 2014 - 1 694 MW
- 4 042 MW - Ontario leads provinces in wind generation - Up 16% in 2015 from 2014
- Decline in the price of propane in Edmonton - 2015 versus 2014 - 88%
- 300,000 barrels/day - Line 9B reversed and expanded - Up from 240,000 barrels per day
- 2.4 Bcf/d - Volume of gas exports to the U.S. West in 2015 - Up 15% year-over-year on higher U.S. gas-fired power generation demand
- Canadian electricity exports hit record - Up 20% in 2015 from 2014 - 58 TW.h
- 45% Drop in Canadian crude-by-rail exports - 2015 Q2 versus 2014 Q2
- Natural gas storage in Canada and the U.S. reaches a new record - In November 2015 - 4.7 Tcf
- 1/4 The Montney’s share of total WCSB natural gas production - Estimated production of 3.6 Bcf/d by the end of 2015
- Average 2015 price of gasoline in Canada - Down 15% from $1.28 per litre in 2014 - $1.09 per litre
- 14% Drop in Alberta’s refined petroleum product demand - From January to October 2015 versus 2014
- Number of LNG export terminals operating in Canada - As of December 2015 - 0
- 42% Decline in the value of crude oil exports - Despite export volumes growing 13% in 2015 from 2014
- 90% of Canadians living in a province with broad-based carbon pricing - If Alberta, Ontario and Manitoba implement announced climate plans in the coming years
Energy Consumption in Canada
Drivers of Energy Use Point to a Modest Increase in Consumption in 2015
Canadian energy use depends on several factors including: weather, technology improvements, consumer preferences, and economic variables such as income, employment rates, industrial activity, and energy prices. Several competing factors put upward and downward pressures on energy use in 2015 as shown in Figure 1.
Figure 1 Canadian Energy Demand Drivers, Change From 2014
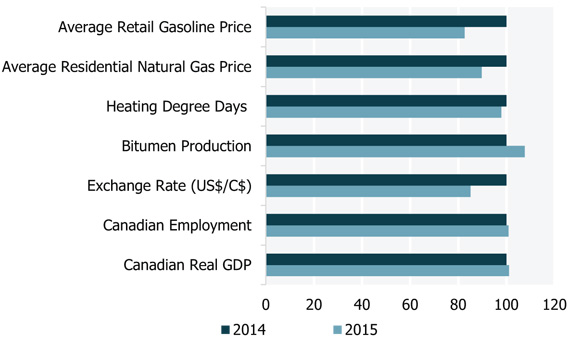
Note: 2014 numbers are indexed to 100. Value for 2015 represents the change from 2014.
Text version of this graph
Sources: Bank of Canada, Statistics Canada, NEB
Description: This bar chart compares several drivers of energy use between 2014 and 2015. Factors that placed upward pressure on energy demand in 2015 include: lower retail gasoline and residential natural gas prices, and higher bitumen production. Factors that placed downward pressure on energy demand in 2015 include: slower economic growth and fewer heating degree days.
Upward pressures on energy demand included lower natural gas prices (which encouraged greater consumption), a colder-than-average winter in Quebec and Atlantic Canada, and increased air conditioning demand due to a warm summer in most provinces.
An increase in energy-intensive oil and gas production also put upward pressure on energy demand in 2015, with bitumen production increasing 12 per cent over 2014 levels.
Vehicle fuel efficiency continues to improve within individual categories. However, the trend of consumers preferring larger, more energy consuming vehicles such as trucks, sport utility vehicles, and minivans over lighter passenger cars continued in 2015. Total vehicle sales increased 2.7 per cent year-to-date, with sales of heavier vehicles up nearly eight per cent and sales of lighter passenger cars down by five per cent.
Slower economic growth was the main factor that reduced energy demand in 2015. Canada’s GDP declined in the first two quarters of 2015 before resuming modest growth in the rest of the year. Although total employment increased, significant job losses occurred in several sectors, particularly natural resources. Temporary shutdowns at coal and potash mines due to low commodity prices further reduced energy use. Further downward pressure on energy demand resulted from the fact that in Ontario, and in much of western Canada, heating requirements in 2015 were lower than in 2014, which had a notably severe winter.
Energy Use Trends in 2015 Vary by Fuel Type and Region
Overall, natural gas demand stayed flat in 2015. Natural gas sales to the industrial sector grew by over three per cent from January to November compared to the same period in 2014, but this growth was offset by declining residential and commercial natural gas demand due to warmer weather in western Canada.
Refined petroleum product (RPP) demand in Canada is typically comprised of 40 per cent gasoline and 30 per cent diesel, with the remainder consisting of products such as jet fuel, asphalt, and kerosene. Total product demand was lower in 2015 than in 2014, despite lower prices. Much of this appears to be related to economic factors, particularly the effect of the oil price drop on Alberta’s economy and industrial production. Alberta’s January to October RPP sales dropped by 14 per cent in 2015, although 2015 RPP sales in most other provinces are similar to 2014 sales as shown in Figure 2.
Figure 2 Refined Petroleum Product Sales by Province
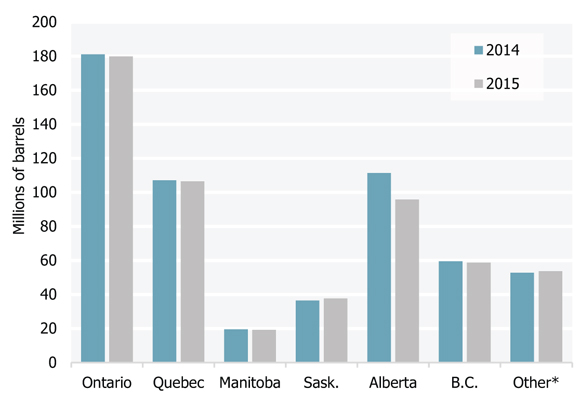
Note: For the period of January to October, 2014 versus 2015.
* Other includes Atlantic Canada and the northern territories, which are aggregated here due to confidentiality restrictions in the source data.
Text version of this graph
Source: Statistics Canada
Description: This column chart compares refined petroleum product sales by province, from the period of January to September in 2014 and 2015. While most provinces show a slight increase or little change, sales in Alberta declined 14 per cent in 2015.
Total electricity use in Canada was largely flat. Increased electricity use related to space heating in Quebec and Atlantic Canada was offset by declining demand in Ontario, slower demand growth in Alberta, and the effects of a warm winter across much of western Canada.
Crude Oil: Global Developments
Crude Oil Prices Stay Low and Supplies Stay High
The WTI crude oil benchmark ended 2015 at a six-year low of US$35 per barrel. As shown in Figure 3, WTI at Cushing, Oklahoma averaged $US50 per barrel in 2015, while the North Sea-based Brent benchmark averaged US$55 per barrel. The heavy crude oil Western Canadian Select (WCS) benchmark averaged US$37 per barrel at Hardisty, Alberta.
Figure 3 Global Crude Oil Benchmark Prices
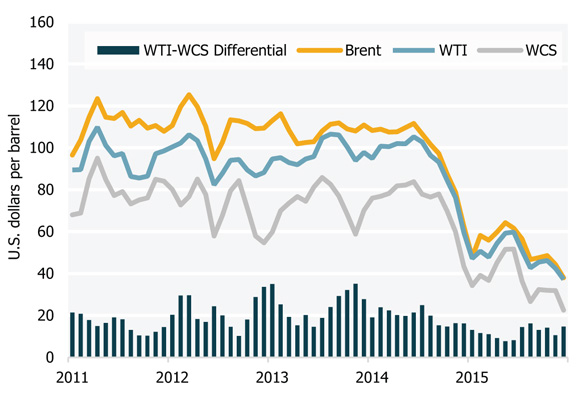
Text version of this graph
Source: PIRA
Description: This chart shows the price of crude oil for major benchmarks over the period of 2011-2015. Since mid-2014, crude oil prices have dropped substantially as a result of oversupply in world markets. At the end of 2015, WTI traded at about US$35 per barrel.
The Organization of Petroleum Exporting Countries (OPEC) continued to produce at high levels, which combined with very high global crude oil inventories, provided the market with a substantial supply cushion. In non-OPEC countries, year-over-year supply growth fell by 46 per cent, to 1.3 million barrels per day (MMb/d) in 2015 from 2.4 MMb/d in 2014. A reduction in U.S. drilling resulted in U.S. crude oil production growth slowing from 1.2 MMb/d in 2014 to 0.7 MMb/d in 2015.
U.S. crude production and inventory trends illustrate the market supply challenge in 2015. With continued strong growth in U.S. crude oil production in the beginning of 2015, commercial crude oil stocks reached an all-time high of 490 million barrels in April. Higher U.S. gasoline demand and slowing crude oil production led to inventory declines during the summer. However, by the fourth quarter, U.S. inventories resumed accumulating, and ended 2015 at 483 million barrels, up 26 per cent from the end of 2014.
Ongoing Uncertainty and Adjustment in Global Oil Markets
Analysts expect that it will take time to rebalance the global oil market. Low prices are expected to continue supporting global crude oil demand growth, which the International Energy Agency (IEA) estimates more than doubled to a five-year high of 1.8 MMb/d in 2015.
Swift and dramatic reductions in capital investments have already occurred in non-OPEC countries, including Canada, where the Canadian Association of Petroleum Producers estimates that the upstream sector reduced spending by approximately 40 per cent in 2015. The low price environment is expected to lead to further reductions in non-OPEC spending and supply in 2016.
In late December 2015, U.S. lawmakers lifted the ban on the export of crude oil which had been in place since 1975. However, given current U.S. crude oil prices relative to international prices, and expectations of lower near-term growth in U.S. light, tight oil production, it could be some time before significant export volumes are reached. Canadian producers, who currently rely on exports to the U.S., are likely to benefit over the long term as exports from the U.S. are expected to support U.S. crude oil price competitiveness based on international markets.
Other key market uncertainties include: the level and timing of increased Iranian oil exports following the lifting of economic sanctions, evolving OPEC policy, the effects of an economic slowdown in China, and the prospects for U.S. light, tight oil production.
Canadian Exports Reach Record Level, but Revenues Drop
Despite record high export volumes, Canadian crude oil export revenue dropped substantially in 2015. (Figure 4) Estimated revenue from oil exports in 2015 was $41.2 billion, a decline of 42 per cent from 2014. This has had a significant effect on Canada’s economy and balance of trade. The Bank of Canada estimated that low oil prices reduced Canadian GDP by 1.25 per cent in the first half of 2015.
Figure 4 Canadian Crude Oil Net Export Revenue and Volume
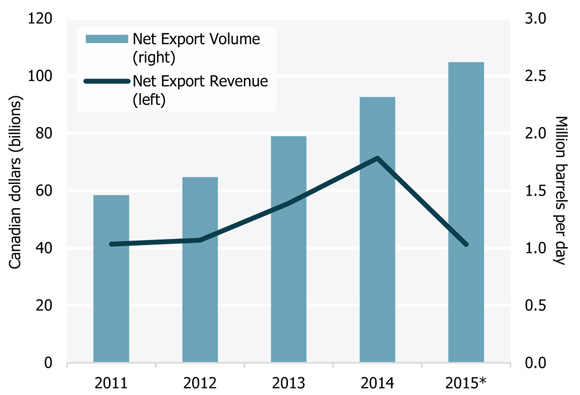
Note: * Estimated for 2015 using actual data from January to November.
Text version of this graph
Source: NEB and Natural Resources Canada
Description: This chart shows Canadian crude oil export volumes and prices over the period of 2011-2015. During this time, export volumes grew steadily due to increasing western Canadian supply. Export revenues grew steadily through to 2014, but dropped by an estimated 39 per cent in 2015 due to lower crude oil prices.
Crude Oil: Western Canada
Production Growth Slows While Crude Oil Storage Reaches Record Highs
Total western Canadian oil production increased from an annual average of 3.53 MMb/d in 2014 to 3.66 MMb/d in 2015, the smallest annual growth in oil production since 2009.
Coinciding with record high crude oil stocks in the U.S., western Canadian crude oil storage levels also rose to an all-time high of 27 MMb in late August 2015, according to data from Genscape. Storage levels declined in September but increased in the final quarter to close the year out at over 25 MMb.
Figure 5 Western Canadian Crude Production
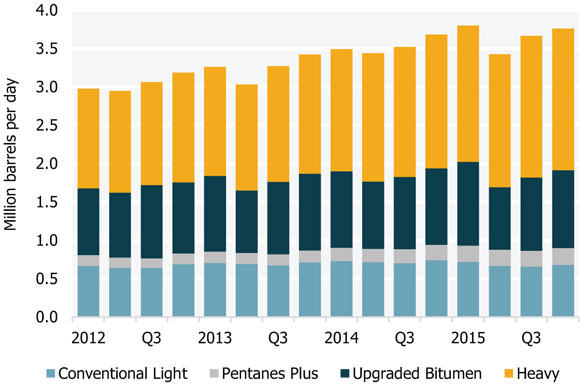
Note: Data estimated for 2015 Q3 and Q4.
Text version of this graph
Source: NEB
Description: This stacked column chart shows quarterly western Canadian crude production by type between 2012 and 2015. In general, western Canadian crude production continues to grow, though production growth in 2015 was less than in previous years.
Differentials Narrow on Upgrader Maintenance and Alberta Forest Fires
In June and July, the differential between WTI and WCS narrowed to approximately US$8 per barrel - the smallest differential since 2009. This narrow differential was related to the temporary loss of more than 200 thousand barrels per day (Mb/d) of bitumen production because of upgrader maintenance and wildfire-related facility shutdowns in northern Alberta. Heavy oil production returned to normal in July. In mid-August, a two-week outage at the BP refinery in Indiana, and a four-day shutdown on Enbridge’s Flanagan South pipeline lowered demand for Canadian heavy crude oil, leading to the differential widening again in the autumn.
In the fourth quarter of 2015, total heavy oil production grew steadily as oil sands projects resumed regular operations, and other projects ramped up production. Oil sands projects from Imperial Oil, ConocoPhillips, Husky Energy, Athabasca Oil, and Pengrowth had gains, with new phases commissioned in 2015. However, the low price environment has also resulted in numerous oil sands projects being cancelled or deferred in 2015. Most of these projects had not begun construction, with the notable exception of Shell’s Carmon Creek project, which was put on hold indefinitely in October.
Canadian Crude by Rail Exports Decline in 2015
Exports of Canadian crude oil by rail averaged 132 Mb/d in 2015, down 18 per cent from 2014. There was a notable low in railed exports in the second quarter of 2015, when the WTI-WCS differential was narrow and approximated the cost of pipeline transportation, which is roughly half to two thirds of the cost of rail transportation.
For example, the transportation cost for rail from Alberta to the U.S. Gulf Coast is around US$15 to US$22 per barrel, versus approximately US$7 to US$13 per barrel for pipeline. Shipping crude oil by rail tends to increase as the differential widens because higher prices in markets such as the Gulf Coast offset the higher cost of rail. As the differential widened in the late summer, volumes of crude oil exported by rail from western Canada picked up again. (Figure 6)
Figure 6 Crude by Rail Exports and the WTI-WCS Differential
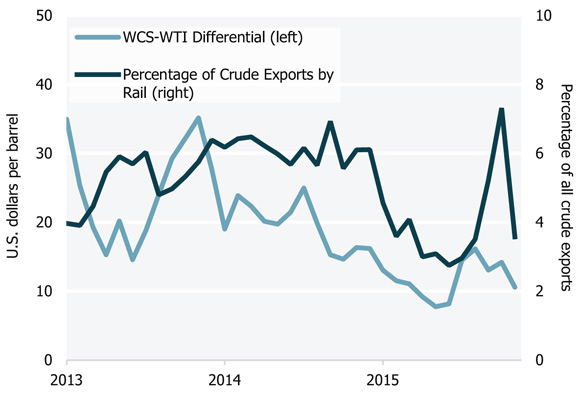
Text version of this graph
Source: PIRA, NEB, NEB calculations
Description: This line chart shows WCS-WTI differentials and crude by rail exports between 2013 and 2015. Starting at the beginning of 2014, the WCS-WTI differential has been narrowing and rail exports have followed this trend and been declining.
Total Canadian crude oil movement by rail, both exports and domestic, is estimated to be 173 Mb/d for 2015, a 12 per cent decrease from 2014. This decrease is largely due to low oil prices squeezing rail’s economic viability.
In 2014, roughly half of all Canadian crude by rail exports were delivered to the U.S. East Coast and one-third were delivered to the U.S. Gulf Coast. In 2015, the share of exports delivered to the Gulf Coast increased to one-half, while the share to the East Coast declined to one-third.
Crude Oil: Other Canadian Regions
Industry Pulls Back From Northern Oil, Heads to the East Coast
In June 2015, Imperial and BP deferred their Beaufort Sea drilling program, joining Chevron, which canceled its Beaufort Sea program in late 2014. Meanwhile, Husky and ConocoPhillips suspended further shale oil exploration in the Northwest Territories’ (NWT) Central Mackenzie Valley because of high costs and low oil prices. The region’s shale oil resource was assessed by the NEB and NWT Geological Survey in October 2015 at 191 billion barrels.
As illustrated in Figure 7, following two years of zero work bids (that is, the amount of money a bidder commits to spend exploring an area) and low oil prices, interest in exploring the East Coast resumed in 2015. Shell Canada started drilling an exploration well offshore of Nova Scotia in October 2015, the first in the area since December 2005. In 2011, a Government of Nova Scotia sponsored study indicated the region has undiscovered potential of eight billion barrels of oil and 121 trillion cubic feet (Tcf) of natural gas. Shortly thereafter, BP and Shell committed $2.1 billion for related exploration rights.
Figure 7 Work Expenditure Bids in Frontier Regions
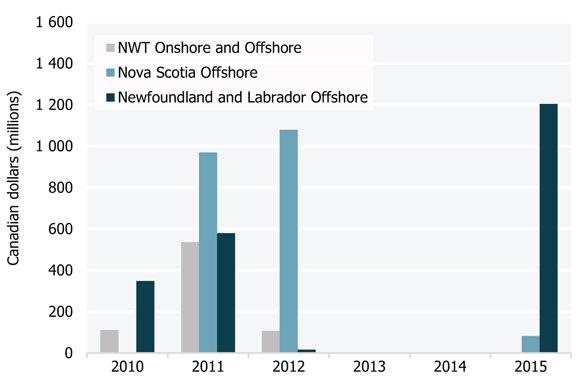
Text version of this graph
Source: Canada-Newfoundland and Labrador Offshore Petroleum Board, Nova Scotia Offshore Petroleum Board, Aboriginal Affairs and Northern Development Canada
Description: This chart shows the work bids made in relation to petroleum rights in the Northwest Territories and in the offshore areas of Nova Scotia and Newfoundland and Labrador from 2010 to 2015. While there was varying activity in the three jurisdictions between 2010 and 2012, no work bids were made in any jurisdiction in 2013 and 2014. In 2015, however, companies started bidding again, led by a record $1.2 billion bid for some parcels in the offshore of Newfoundland and Labrador.
The Government of Newfoundland and Labrador released a similar study of the Flemish Pass region in October 2015 that estimated its undiscovered potential to be 12 billion barrels of oil and 113 Tcf of natural gas. In November 2015, a group of companies committed $1.2 billion in spending for that area’s exploration rights.
In Quebec, Junex and Petrolia both discovered conventional, onshore oil on the Gaspé Peninsula. Junex claimed a discovery of 81 million barrels of oil resources, eight million barrels of which is potentially recoverable. Petrolia began production tests of its Gaspé discovery well in November. Meanwhile, the Government of Quebec released studies from an environmental assessment of the Macasty Shale of Anticosti Island. The assessment [French only] estimates that the Macasty Shale likely contains 44 billion barrels of oil equivalent and would likely be economic if developed.
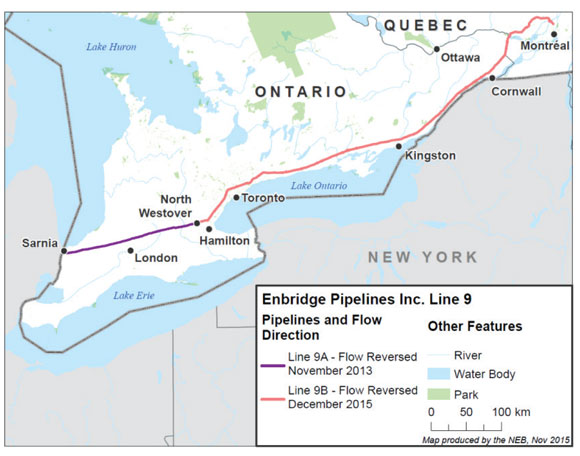
Enbridge’s Line 9 Reversed and Expanded, Energy East Amendments Filed
In December 2015, flow on the Line 9B pipeline (Figure 8) between North Westover, Ontario, and Montreal, Quebec was reversed and its capacity was expanded by 60 Mb/d to 300 Mb/d. The section of Line 9 that runs from Sarnia, Ontario to North Westover previously transported western Canadian and North Dakota oil to the southern Ontario market. The Line 9B reversal makes the same oil available to refineries in Quebec, reducing eastern refineries’ reliance on imports of more costly foreign crude.
Figure 8 Map of Enbridge Line 9
Text version of this graph
Source: NEB
Description: This map shows the Enbridge Line 9 pipeline system, which runs from Sarnia, Ontario to Montreal, Quebec. While the pipeline previously delivered crude oil from Montreal to refineries in Sarnia, the pipeline was reversed in November 2013 to deliver oil from Sarnia to refineries in North Westover, which is just northwest of Hamilton, Ontario. In December, 2015, the remaining portion of the pipeline was reversed so that oil can flow from Sarnia all the way to Montreal.
The Energy East Pipeline Project application was filed with the NEB in October 2014. Energy East is a 4 600 km pipeline proposed to carry 1.1 MMb/d of western Canadian crude oil to refineries and export facilities in eastern Canada. In April 2015, TransCanada announced that it was making a route adjustment to remove a port in Quebec from the project’s scope and in December 2015, TransCanada filed amendments to the Energy East application. The amendments included 700 route adjustments. Energy East is targeting an in-service date of 2020 if it receives the necessary regulatory approvals and permits.
Natural Gas Liquids
Crude Oil Price Decline Pulls Down Liquids Prices
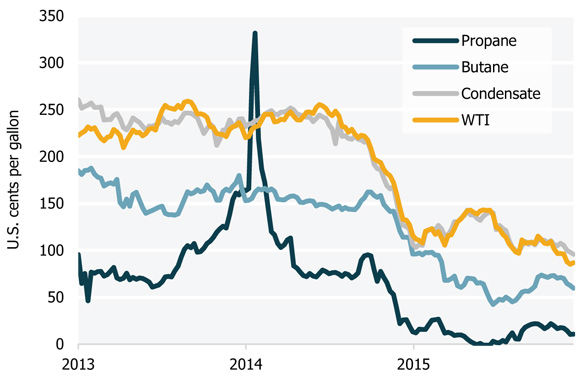
In 2015, natural gas liquids (NGL) prices were at their lowest levels in a decade, driven primarily by the fall in crude oil prices. The annual average price of WTI declined by 48 per cent between 2014 and 2015, while the annual average prices for propane, butane, and condensate at the Edmonton NGL price hub declined by 87, 54, and 46 per cent, respectively. (Figure 9)
Figure 9 NGL Prices at Edmonton and WTI
Text version of this graph
Source: Oil Price Information Service
Description: This line chart illustrates the price of NGLs at the Edmonton hub and the price of WTI in U.S. cents per gallon from 2013 to 2015. From 2014 to 2015, the annual average price of WTI declined 48 per cent, while the annual average prices of propane, butane and condensate at the Edmonton hub declined 87, 54 and 46 per cent, respectively.
The propane market has experienced significant turbulence in recent years, from the crop drying and Polar Vortex-driven demand shock of 2013/14 to swelling U.S. supply and storage overhangs in 2015. In fact, the storage surplus in Edmonton was so large following the 2014/15 winter that underground inventories in March were three times the five-year average and over seven times the volume reported in March 2014. This surplus, combined with a bottleneck in moving propane out of Edmonton, resulted in propane prices trading at or below zero in June.
In response to the drop in NGL prices, some gas processing plants in Alberta chose not to extract liquids from the natural gas. Instead, the liquids remained in the gas stream and are sold as heat to users of natural gas.
Propane Exports Increase in 2015, but Export Value Plummets
Low western Canadian prices incented producers to increase propane export volumes in 2015. Despite this increase, the value of exports reached a ten-year low in 2015 due to low prices and western Canadian propane selling at a discount in order remain competitive in the well-supplied U.S. market.
The increase in exports was facilitated by rail movements, as pipeline exports declined following conversion of the Cochin Pipeline from a propane export line to a condensate import line in April 2014. Rail now transports three-quarters of Canadian propane exports, and this share could continue to increase in 2016 following completion of Keyera’s 40 Mb/d Josephburg Rail Terminal near Fort Saskatchewan, Alberta in July 2015.
The export volumes in Figure 10 only account for specification propane, and do not include the NGLs moved in the natural gas stream on the Alliance Pipeline. The Alliance Pipeline, which delivers liquids-rich natural gas from western Canada directly to the Aux Sable gas plant in Illinois, saw its volume of entrained liquids increase in 2015 due to low NGL prices in western Canada relative to NGL prices in the U.S. Midwest.
Figure 10 Canadian Propane Exports by Mode and Export Value
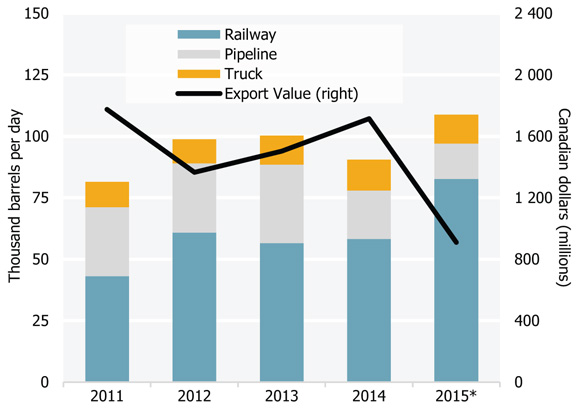
* Estimated for 2015 using January to November data.
Text version of this graph
Source: NEB
Description: This stacked bar chart illustrates Canadian propane exports by mode of transport from 2011 to 2015. An overlapping line chart illustrates the value of Canadian propane exports. The stacked bar chart showcases the declining role that pipelines have played in moving propane out of Canada. Meanwhile, rail now accounts for over 75 per cent of export volumes. The stacked bars also show that total propane exports grew 17 per cent to 105 Mb/d in 2015. However, the value of propane exports is predicted to decline 48 per cent, from $1.7 billion in 2014 to $900 million in 2015.
NGL Infrastructure Expansions in the Works
In November 2015, the NEB approved Pembina’s application to export up to 75 Mb/d of propane from Canada for a period of 25 years. The export facility is currently planned for Portland, Oregon.
With expectations of ethane production from North Dakota growing, Veresen announced plans in November to develop one million barrels of ethane storage capacity near the Empress, Alberta NGL complex. The storage caverns, expected to be in operation in 2018, would be used primarily by NOVA, which manufactures ethylene from ethane in Joffre, Alberta.
Canadian Gasoline Prices
Despite Low Crude Prices, Gasoline Prices Climbed During Summer 2015
While the price of crude oil is a significant component of the price of gasoline at the pump, it is not the only component as taxes, refinery margins, and retail margins are also factors. However, crude oil is generally the most volatile component, and the price of gasoline tends to track the price of crude oil closely.
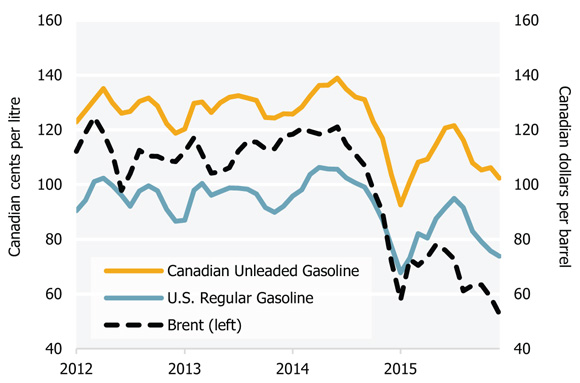
Canadian gasoline pricesFootnote 1 weakened steadily over the last half of 2014, falling to a six-year low of 92.6 cents per litre in January 2015. Gasoline prices climbed through the first half of 2015 reaching a high of 138.9 cents per litre in June 2015, and in doing so, followed the general trend of Brent crude,Footnote 2 which also increased between January and June 2015, but at a lower rate than the price of gasoline. (Figure 11) Other factors that influenced the price of gasoline in 2015 in Canada are discussed below.
Figure 11 Gasoline Prices in Canada and the U.S.
Text version of this graph
Sources: EIA, Natural Resources Canada, Bank of Canada, NEB calculations
Description: This line graph shows the monthly price of gasoline in Canadian cents per litre for Canada and the U.S. from 2012 to 2015. The graph also illustrates the price of Brent crude in Canadian dollars per barrel. Though the price of gasoline tends to track the price of crude oil, gasoline prices disconnected from crude oil prices over the summer of 2015.
Factors at Play Included Strong Demand and Refinery Outages
As shown in Figure 12, average U.S. gasoline demand from January to October 2015 was 3.5 per cent above the five-year average, primarily due to the relatively low price of gasoline in 2015. Gasoline demand was also higher in Canada, where demand over the first eight months of 2015 was 2.5 per cent higher than the five-year average.
Figure 12 Monthly U.S. Gasoline Demand
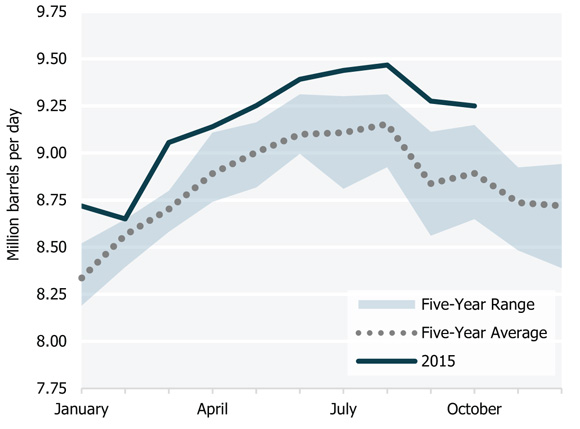
Text version of this graph
Source: EIA
Description: This line and area graph illustrates monthly U.S. gasoline demand for 2015 as well the five-year range for, and five-year average of, U.S. gasoline demand. The graph shows that U.S gasoline demand in 2015 was above the five-year range for all months in 2015 with available data at the time of publication.
This high demand, combined with supply reducing refinery outages in Canada, and the U.S. Midwest and Gulf Coast regions, were the primary factors behind gasoline prices in the U.S. and Canada trending upwards over the summer. Although the U.S. gasoline market is ten times the size of the Canadian market, the two markets are highly integrated and tend to follow similar price trends. Gasoline also typically trades at a stable differential between Canada and the U.S. as illustrated in Figure 11, with the difference primarily reflecting higher taxes in Canada.
Gasoline Prices Declined in Second Half of the Year
By the end of the summer, lower crude oil prices, lower seasonal demand, growing U.S. gasoline inventories, and the completion of maintenance at refineries resulted in gasoline prices in both Canada and the U.S. declining. By December, Canadian gasoline prices declined to 102.3 cents per litre, a 17 per cent decline from 121.5 cents per litre in July.
Natural Gas: North American Trends
Supply on Eastern Canada’s Doorstep
Natural gas flows in North America are changing. Natural gas from the rapidly developing Marcellus and Utica Shales of the U.S. Northeast is increasingly serving markets that were previously served from the Western Canada Sedimentary Basin (WCSB). (Figure 13) The Marcellus, which produced just under 2.0 billion cubic feet per day (Bcf/d) in 2009 has grown to average 16 Bcf/d in 2015. To put the size and growth of the Marcellus in context, this region added “a Canada’s worth” of production to the North American integrated gas market in just six years.
Figure 13 Map of WCSB and Northeast U.S. Shale Gas Basins
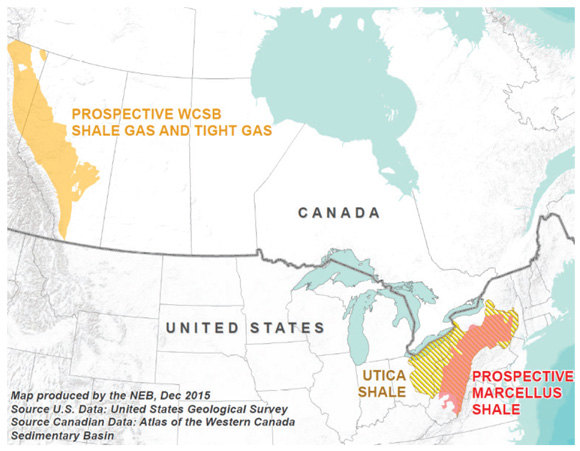
Text version of this graph
Source: United States Geological Survey and Atlas of the Western Canada Sedimentary Basin
Description: This map illustrates the location of the predominant sources of natural gas consumed in Canada. The WCSB is located in Alberta and stretches into northeastern B.C. The Utica Shale and the Marcellus Shale primarily located on the western flank of the Appalachian Mountains in the northeastern U.S.
To enable delivery of U.S.-produced natural gas into eastern Canada and to meet growing demand in that market, new pipeline infrastructure is being built and existing infrastructure is being expanded. For example, Niagara, historically an export point, was reversed in late 2012 to enable the import of approximately 400 billion cubic feet per day (Bcf/d) in MMcf/d from the U.S. into eastern Ontario. In the last quarter of 2015, capacity at Niagara was further expanded and the point saw imports increase to approximately 600 MMcf/d. Also in late 2015, the Chippawa export point was reversed to allow for the import of approximately 150 MMcf/d into Ontario.
North American Gas in Storage Sets New Record, Keeps Prices Low
Rapid development of shale gas resulted in North American natural gas in storage reached reaching record high levels in November 2015.Footnote 3 This storage accumulation, as shown in Figure 14, is particularly remarkable considering that storage levels following the 2014 Polar Vortex fell below 1.0 trillion cubic feet (Tcf). However, by mid-September 2015, the U.S. had surpassed its previous storage record of 3.9 Tcf. Canadian storage levels remained close to the five-year average throughout the injection season and peaked at 0.7 Tcf in mid-November, resulting in record combined Canadian and U.S. storage of 4.7 Tcf.
Figure 14 Combined Canada and U.S. Natural Gas in Storage
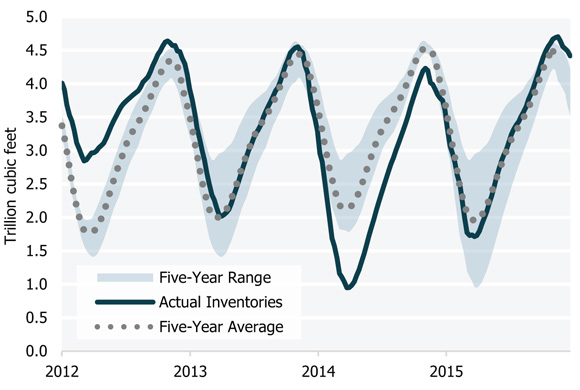
Text version of this graph
Source: Canadian Enerdata, EIA, NEB calculations
Description: This line and area graph illustrates combined underground natural gas storage inventories in Canada and the U.S., reported from 1 January 2012 to 31 December 2015. Five-year averages and ranges for the same period are also shown. In November 2015, natural gas in storage in Canada and the U.S. reached a record 4.7 Tcf.
The robust storage situation and a warm start to the 2015/16 winter resulted in the daily spot price at Henry Hub declining to US$1.70 per million British thermal units (MMBtu) in mid-December, its lowest level since 1999.
During 2015, natural gas at Henry Hub traded at an average of US$2.61 per MMBtu while intra-Alberta gas traded at an average of $2.56 per gigajoule (GJ). Henry Hub and intra-Alberta prices were both down 40 per cent from 2014. Prices at the Dawn hub in Ontario averaged $3.55 per GJ in 2015, down 50 per cent from 2014.
Warmer Weather in the Western U.S. Pulls Gas Exports Westward
Exports from the WCSB to the U.S. West via the Huntingdon and Kingsgate export points in British Columbia (B.C.) increased 15 per cent in 2015 compared to 2014. Higher temperatures in the U.S. West resulted in increased demand for gas-fired power generation to meet air conditioning demand. Canadian natural gas exports to the U.S. Midwest fell seven per cent in 2015 to an estimated 3.6 Bcf/d. Canadian exports to the Midwest have declined approximately 30 per cent since 2011 as gas from the U.S. Northeast continues to displace western Canadian exports. Total Canadian exports in 2015 remained flat at 7.4 Bcf/d.
Natural Gas: Canadian Production
Growing Supply and System Constraints Result in Low Prices in B.C.
The Montney supply area in northeastern B.C. continued to grow in 2015. In the NEB’s latest Canadian natural gas deliverability report, Montney production was expected to reach 3.6 Bcf/d by late 2015. The Montney now accounts for 25 per cent of total WCSB production, up from six per cent in 2010 when production was 0.9 Bcf/d.
As supply from northeast B.C. increased, pipelines became fully contracted at some points. Several other developments also added to system constraints in the region: the Nova Gas Transmission Ltd. (NGTL) system was subject to pressure restrictions; Westcoast and NGTL both experienced maintenance outages that were sometimes simultaneous; and the Alliance Pipeline was shut down for six days in August.
Increasing supply and constrained access to markets resulted in natural gas trading at average monthly prices of approximately $1.12 per GJ at Westcoast Station 2 (located near Chetwynd, B.C.) during the last quarter of 2015. During several days in the second half of 2015, the spot price fell below $0.50 per GJ. By comparison, intra-Alberta natural gas was trading at an average monthly price of $2.35 per GJ in the last quarter of 2015.
Figure 15 Intra-Alberta and Station 2 Natural Gas Prices in 2015
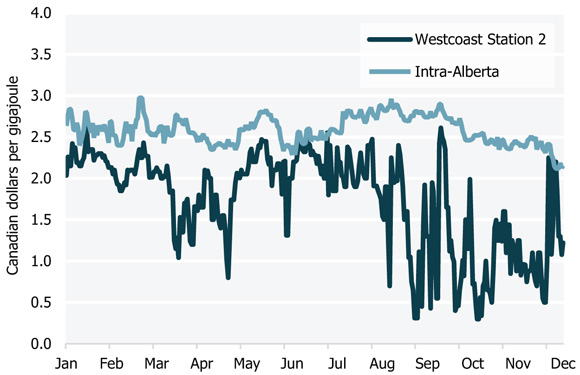
Text version of this graph
Source: NGX
Description: This line graph compares natural gas spot prices at Intra-Alberta, a Canadian benchmark price, against Station prices on the Westcoast pipeline system located in B.C. Prices at Station 2 reached lows around 30 to 50 cents per GJ between August and October due to a variety of market factors.
WCSB Gas Production Remains Flat Despite Declining Rig Activity
Despite supply growth from northeastern B.C. in 2015, gas-directed drilling activity in the WCSB as a whole declined in 2015 as shown in Figure 16. As of mid-December, the number of active gas rigs in the WCSB declined by 55 per cent compared to the same period last year. A sustained low price environment, amply supplied markets, and increasing competition from the U.S. are factors that dampened drilling activity.
Figure 16 Western Canada Gas-Directed Rig Counts
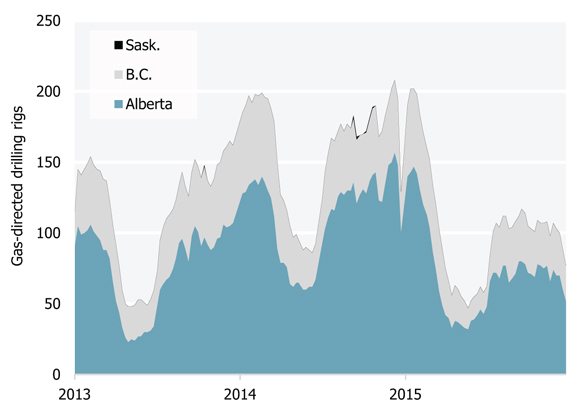
Text version of this graph
Source: JuneWarren-Nickle’s
Description: This graph displays the number of natural gas-directed rigs active in B.C., Alberta, and Saskatchewan from January 2013 to December 2015. There has been a steep decline in active rigs from 2014 to 2015.
Decreased capital expenditures throughout 2015 also contributed to the reduction in the number of new wells drilled. Producers focused drilling efforts on the most economic prospects and improved production per well. This allowed overall WCSB marketable production to remain relatively flat in 2015 at an estimated 14.8 Bcf/d.
Sable Production Declines Further, Deep Panuke Starts Producing Seasonally
Production at ExxonMobil’s Sable Offshore Energy Project continued to drop in 2015, averaging 122 MMcf/d in the second half of the year. Sable’s production has averaged 140 MMcf/d over the last three years - about one-third of what it produced during its first 10 years.
Encana’s Deep Panuke offshore platform is now only producing natural gas seasonally, with Encana halting production in May and resuming production in October when demand and prices in the region are higher. Deep Panuke’s reserve estimates were also halved from 400 Bcf to 200 Bcf due to higher than expected water incursion into the reservoir.
Liquefied Natural Gas
Global LNG Supply Growth Jumps in 2015 but Global Demand Flat
In 2015, global LNG supply increased by approximately three Bcf/d, or eight per cent. Projects under construction, mostly in Australia and the U.S., will add another 13 Bcf/d of liquefaction capacity by 2019 as illustrated in Figure 17. In the U.S., exports at the Sabine Pass terminal in Louisiana are expected to commence in the first quarter of 2016. Four other liquefaction projects are currently under construction in the U.S., totaling 8.0 Bcf/d of export capacity.
While liquefaction capacity expanded, demand growth moderated to approximately one per cent in 2015. Warmer 2014/15 winter temperatures and the addition of nuclear capacity from new builds and restarts reduced the need for LNG imports in Japan and South Korea. Combined, these two countries account for roughly half of the global LNG market.
Figure 17 LNG Liquefaction Capacity Additions: 2010 to 2019
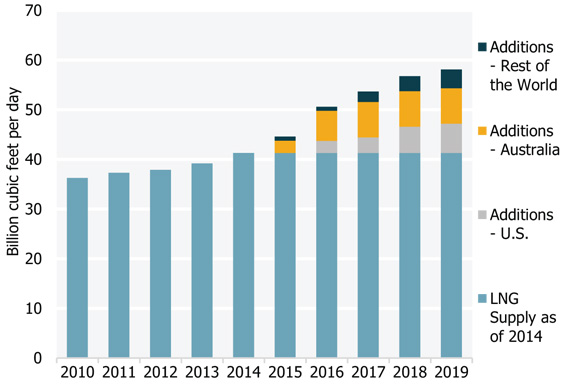
Text version of this graph
Source: International Gas Union
Description: This stacked column chart shows global existing and under-construction natural gas liquefaction capacity from 2010 to 2019. The majority of the new capacity added between 2015 and 2019 will be located in Australia and U.S.
As shown in Figure 18, LNG prices decreased sharply in 2015. The monthly average of the Japan Korea Marker spot price fell from a high of US$19.40 per MMBtu in early 2014 to an average of US$7.45 per MMBtu in 2015. Prices for LNG traded under oil-linked contracts dropped in response to the decline in crude oil prices.
Figure 18 LNG and Henry Hub Natural Gas Prices
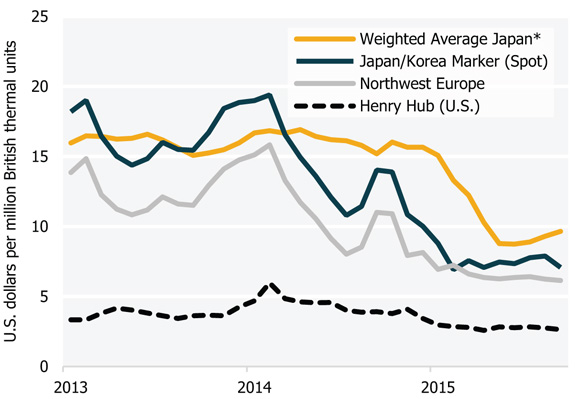
* Average LNG import price for Japan.
Text version of this graph
Source: Ministry of Finance Japan, GLJ, Platts
Description: This graph illustrates LNG and natural gas benchmark prices. While natural gas prices remained relatively stable, LNG import prices in the Asian and northwest European markets started declining in 2014 and remained low throughout 2015.
The low price environment made it easier for buyers to find competitively priced supplies and more difficult for potential LNG suppliers to secure long-term contracts. Furthermore, the decline in crude oil prices affected the earnings of oil and gas companies, which are typically involved in the development of LNG terminals. If the low price environment persists, these companies may now be less inclined to invest in costly terminal projects.
No Canadian Liquefaction Terminals Under Construction
By the end of 2015, the NEB approved export licences for 22 LNG projects totaling more than 50 Bcf/d of export capacity. However, despite these numerous proposals, no LNG export terminals have started construction in Canada.
While most Canadian projects are proposed for the West Coast, seven licenses, for exports totaling approximately eight Bcf/d, have been granted for projects proposed in Nova Scotia, New Brunswick, and Quebec.
In addition to export licences, LNG project proponents must obtain various permits for the construction of liquefaction facilities and related pipelines. Depending on the specifics of the project, this could include permits from federal and provincial environment assessment organizations, federal and provincial energy regulators, and several other authorizations. As of December 2015, no Canadian projects have obtained all of the required permits.
In June 2015, Pacific NorthWest LNG made a conditional final investment decision and is waiting for an environmental assessment certificate from the Canadian Environmental Assessment Agency to confirm its final investment decision. No other Canadian LNG project has reached the final investment decision stage.
Electricity: Traditional Sources
Canadian Hydro Capacity Expands in 2015
Canada produces more than 60 per cent of its electricity from hydroelectric sources and Canadian hydroelectric capacity continued to expand in 2015. In B.C., two 500 megawatt (MW) units were added at the Mica Dam and construction began on the 1 100 MW Site-C project. Major hydroelectric projects totaling more than 3 000 MW of capacity were also under construction in Manitoba, Quebec, and Labrador.
New Gas-Fired Generation Increases Thermal Generation Capacity in Alberta
Natural gas-fired capacity grew in Alberta, driven by low natural gas prices and expectations for long-term demand growth. In March 2015, commercial operations began at the 800 MW Enmax Shepard Energy Centre, Alberta’s largest gas-fired plant.
However, the low oil price environment could affect future additions in Alberta, since most of Alberta’s electricity demand comes from the industrial sector, including the oil sands. In 2015, Alberta’s electricity demand growth slowed to less than one percent from three percent in 2014.
Wholesale Electricity Prices at or Close to Record Lows in Deregulated Markets
From 2014, annual average wholesale electricity prices in Alberta and Ontario decreased by approximately 30 per cent. In Ontario, prices fell to levels similar to historical lows reached in 2012, after having increased in 2014 due to severe winter conditions. As a result of sizeable capacity additions and slower electricity demand growth, prices in Alberta reached the lowest levels since market deregulation in 2000.
Canadian Net Exports Reach New Record, Additional Export Opportunities Emerging
Canada is a net exporter of electricity, led by provinces with significant hydroelectric capacity. In 2015, net exports reached a record 55 terawatt hours (TW.h), as shown in Figure 19. Capacity additions and lower than expected domestic electricity demand contributed to this milestone.
Figure 19 Canadian Electricity Trade
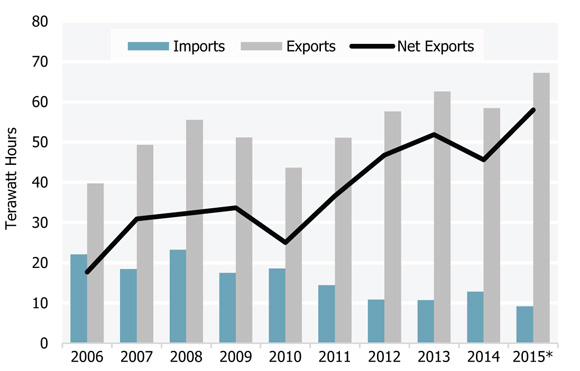
* Estimated for 2015 given January to November data.
Text version of this graph
Source: NEB
Description: This line and bar chart shows annual Canadian electricity exports, imports, and net exports from 2006 to 2015. In general, Canadian net exports have been steadily growing since 2010 with a small decline in 2014. In 2015, net exports reached a record 55 TW.h on account of new capacity additions and lower Canadian demand
Several new international power lines (IPL) between Canada and the U.S. were proposed to take advantage of the electricity capacity surplus in some provinces. In August 2015, the NEB received its first application for a new IPL since 2005. The ITC Lake Erie Connector is a proposed 117 km, 1 000 MW interconnection that would run under Lake Erie between Nanticoke, Ontario and Erie, Pennsylvania. If approved and constructed, the project would provide the first direct interconnection between the Pennsylvania-New Jersey-Maryland electricity market and the Ontario market. Public sources indicate that IPLs may also be proposed in Quebec and Manitoba. (Figure 20)
Figure 20 Proposed Major International Power Line Projects
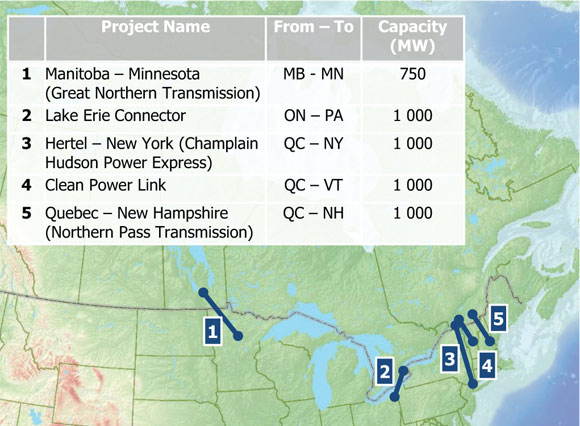
Text version of this graph
Sources: NEB, proponent websites
- Mineesota Power - Great Northern Transmission Line
- ITC Holdings Corp. - ITC Lake Erie Connector
- Transmission Developers Inc. - Champlain Hudson Power Express
- TDI New England - New England Clean Power Link
- Forward NH - Northern Pass
Description: This map illustrates five proposed new international power line projects with a combined line capacity of 4,750 MW. Three projects are located in Quebec and the remaining two are in Ontario and Manitoba.
New U.S. initiatives to increase electricity generation from cleaner sources could create opportunities for Canadian producers. The U.S. Environmental Protection Agency’s 2015 Clean Power Plan is aimed at reducing greenhouse gas (GHG) emissions from the U.S. power sector by 32 per cent from 2005 levels by 2030. The plan would allow individual states to use imported electricity from eligible Canadian sources installed after 2012 to meet their emission reduction targets.
Electricity: Renewable Generation
Canadian Renewable Capacity Growth Strong, but Slowing in 2015
Non-hydro renewable capacity continues to grow, but annual additions slowed considerably in 2015. Solar capacity stood at 1 695 MW, up 11 per cent from 2014. By comparison, total solar capacity grew 48 per cent in 2014. Similarly, wind capacity additions grew by only eight per cent in 2015 compared to 23 per cent in 2014. Notably, Alberta - the province with the third highest installed wind capacity - did not add any new wind capacity in 2015.
Figure 21 Wind Generation Capacity by Province or Region
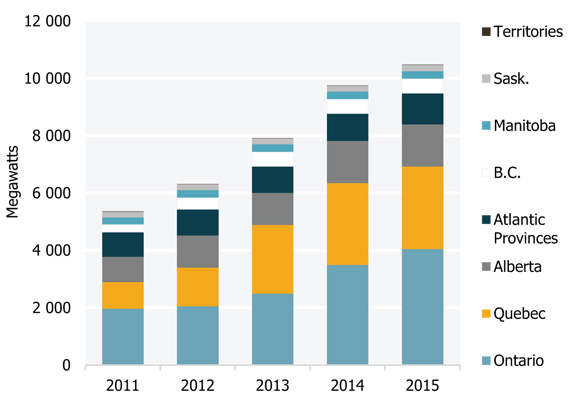
Text version of this graph
Source: Canadian Wind Energy Association
Description: This stacked column chart shows Canada’s total wind capacity additions by year and province or region. In 2015, Canada’s total installed wind capacity surpassed the 10 000 MW mark. Over 80 per cent of installed wind capacity is concentrated in three provinces Ontario, Quebec, and Alberta.
This slowdown in capacity additions can be attributed to slower demand growth, lower prices, and changing incentives. In 2015, electricity demand in Alberta, Ontario, and Quebec was either lower or flat compared to 2014. In addition, average 2015 electricity pool prices in Alberta were below the five-year and ten-year averages. Furthermore, the 2016 contract schedule for Ontario’s solar feed-in-tariff program shows a 24 per cent drop from 2015 contract prices.
While renewable energy sources such as wind, solar, biomass, and geothermal continue to gain ground in Canada, non-hydro renewables still comprise a small percentage of Canada’s total electricity portfolio. In 2014, the latest year for which data is available, non-hydro renewable generating capacity accounted for 9.2 per cent of total generating capacity. Hydro capacity accounted for 55.7 per cent and thermal capacity (coal, nuclear, natural gas, diesel, and oil) accounted for the remainder (Figure 22). However, since wind and solar are intermittent resources, total generation from non-hydro renewables accounted for 4.4 per cent, while hydroelectricity accounts for more than 60 per cent. Given the time it takes for generation capacity to change significantly, the information displayed in Figure 22 will likely not change significantly once 2015 data is made available.
Figure 22 Generation and Capacity by Primary Fuel in 2014
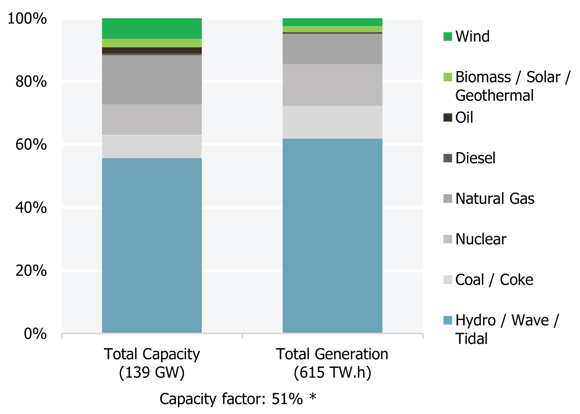
* Capacity factor is the average power generated divided by peak power.
Text version of this graph
Source: Statistics Canada
Description: This stacked column chart compares Canada’s generation capacity and generation share by fuel. Although non-hydro renewables account for 9.2 per cent of capacity, these sources account for only 4.4 per cent of generation. The majority of Canada’s generation comes from traditional sources such as hydroelectricity or thermal generation.
Global Renewable Developments and Technologies Continue Advancing
Penetration by renewable generation has gained significant global momentum in recent years. According to a report by Clean Energy Canada, by the beginning of 2015, global renewable investments had reached US$260 billion. Of that amount, 58 per cent was for wind, 38 per cent for solar, and four per cent for geothermal, biomass, and waste-to-energy. Global wind and solar installed capacity was estimated at approximately 550 gigawatts (GW), with Canada ranking sixth in global wind deployments.
Although the cost of generation from renewables remains higher than more traditional sources, technological advancements have led to reduced costs and greater competitiveness, even as incentives and subsidies decrease. For example, even taking into account newer units that are capable of more generation per unit, the relative cost of solar photovoltaic cells continued to drop in 2015.
Storage technologies also improved, and lithium-ion battery costs fell due to economies of scale. Battery technology is particularly significant because it could help provide a more efficient platform for balancing demand with generation from intermittent resources, as well as provide increased stability when integrating renewables into electricity systems.
GHG Emissions
Climate Policies and Energy Markets Directly Linked
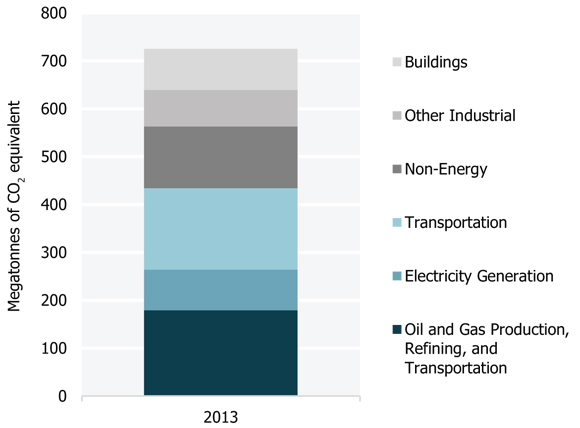
The influence of climate policies and programs on Canadian energy markets is increasing. In 2013, more than 80 per cent of Canada’s GHG emissions in 2013 were attributed to the consumption of fossil fuels. Of Canada’s 726 megatonnes (MT) of GHG emissions, one-quarter was produced by the oil and natural gas sector. Roughly another quarter of emissions were from the transportation sector, with other industries, electricity generation, residential and commercial buildings, agriculture, and waste comprising the remaining half of Canada’s GHG emissions. Figure 23 shows total Canadian GHG emissions from 1990 to 2013, while Figure 24 illustrates the breakdown of 2013’s emissions by sector.
Figure 23 Greenhouse Gas Emissions in Canada
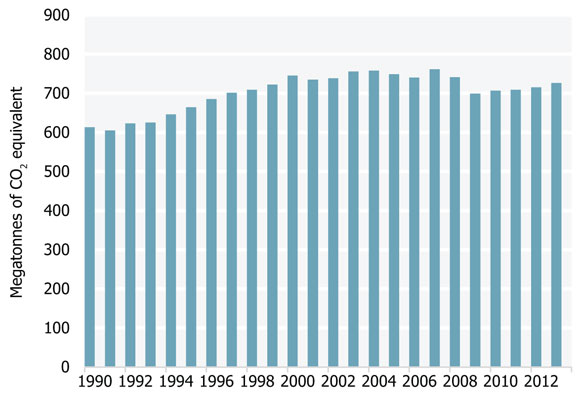
Text version of this graph
Source: Environment and Climate Change Canada
Description: This line chart shows historical greenhouse gas emissions in Canada between 1990 and 2012. Total GHG emissions have grown 18 per cent since 1990 to 726 MT in 2013.
Figure 24 Canadian Emissions by Sector in 2013
Text version of this graph
Source: Environment and Climate Change Canada
Description: This stacked bar chart illustrates Canadian emissions by sector in 2013. A quarter of the emissions (179 MT) were from the oil and gas sector, and another quarter (170 MT) were from the transportation sector. Electricity generation accounted for 11 per cent (85 MT). Non-energy, buildings, and other industrial sectors accounted for the remaining 40 per cent (292 MT).
Alberta Climate Panel Recommends Economy-Wide Carbon Pricing, Additional Policies
The Alberta government convened an advisory panel in the spring of 2015 to review the province’s climate policies, consult with Albertans, and provide advice on a new set of climate policies. In November, the panel released a broad suite of policy recommendations and the Alberta government announced a climate leadership plan based on the recommendations put forward by the panel. The climate leadership plan includes a carbon price that will be applied across all sectors. This economy-wide carbon price will replace Alberta’s existing carbon pricing mechanism, which has been in place since 2007 and applies only to large industrial facilities. The plan also extends carbon pricing to end-use GHG emissions resulting from the combustion of transportation and heating fuels. The climate leadership plan states that the price will start at $20 per tonne of GHG emissions in 2017 and increase to $30 per tonne in 2018. The $30 per tonne price translates into seven cents per litre of gasoline and $1.68 per GJ for natural gas.
The climate leadership plan also states that the Alberta government is moving forward on the following policies: phasing out coal-fired generation by 2030, capping oil sands emissions, and a methane reduction plan for the oil and gas sector; however, details of the final strategy by the Alberta government are still being developed.
Carbon Pricing Well Established in Some Provinces, More Joining In
Broad-based carbon pricing is already in effect in B.C., which has had a carbon tax since 2008, and in Quebec, which implemented a cap-and-trade system in 2013 that is now linked to California’s carbon market. The carbon tax in B.C. is currently set at $30 per tonne while the settlement price of emission permits in Quebec averaged $15.85 per tonne in 2015.
Ontario and Manitoba both announced plans to introduce cap-and-trade systems in 2015 that would be linked to the Quebec and California system. If climate pricing is implemented as proposed in Alberta, Ontario, and Manitoba over the coming years, five provinces representing 90 per cent of Canada’s population will have instituted broad-based carbon pricing. Manitoba currently has a $10 per tonne price for emissions from coal.
Paris Agreement Sets Ambitious Goals for Limiting Global Temperature Increases
For two weeks in late 2015, more than 190 countries met near Paris, France to negotiate a new climate agreement. The negotiations resulted in the Paris Agreement, a document with the main goal of keeping global temperature increases below 2.0 degrees Celsius above pre-industrial levels, and to pursue efforts to limit the temperature increase to 1.5 degrees Celsius above pre-industrial levels.
Appendix A: Acronyms and Units

Photos: Top left: Office towers at night.
Top right: Car taillights moving through a downtown underpass.
Bottom: A view of the Sleeping Giant and Lake Superior from Thunder Bay in the fall.
Appendix B: Data Sources
| Figure | Source | |
|---|---|---|
| Figure 1 | Bank of Canada, Statistics Canada, NEB |  Photo: A cairn overlooking Fish Lake near Whitehorse, Yukon. |
| Figure 2 | Statistics Canada | |
| Figure 3 | PIRA | |
| Figure 4 | NEB and Natural Resources Canada | |
| Figure 5 | NEB | |
| Figure 6 | PIRA, NEB, NEB calculations | |
| Figure 7 | Canada-Newfoundland and Labrador Offshore Petroleum Board, Nova Scotia Offshore Petroleum Board, Aboriginal Affairs and Northern Development Canada | |
| Figure 8 | NEB | |
| Figure 9 | Oil Price Information Service | |
| Figure 10 | NEB | |
| Figure 11 | EIA, Natural Resources Canada, Bank of Canada, NEB calculations | |
| Figure 12 | EIA | |
| Figure 13 | NEB | |
| Figure 14 | Canadian Enerdata, EIA, NEB calculations | |
| Figure 15 | NGX | |
| Figure 16 | JuneWarren-Nickle’s | |
| Figure 17 | International Gas Union | |
| Figure 18 | Ministry of Finance Japan, GLJ, Platts | |
| Figure 19 | NEB | |
| Figure 20 | NEB, proponent websites |
|
| Figure 21 | Canadian Wind Energy Association | |
| Figure 22 | Statistics Canada | |
| Figure 23 | Environment and Climate Change Canada | |
| Figure 24 | Environment and Climate Change Canada |
Appendix C: Data Sources

The NEB is an independent federal regulator whose purpose is to promote safety and security, environmental protection, and economic efficiency in the Canadian public interest within the mandate set by Parliament for the regulation of pipelines, energy development, and trade.
The Board's main responsibilities include regulating:
- the construction, operation, and abandonment of pipelines that cross international borders or provincial/territorial boundaries, as well as the associated pipeline tolls and tariffs;
- the construction and operation of international power lines and designated interprovincial power lines; and
- imports of natural gas and exports of crude oil, natural gas, oil, natural gas liquids, refined petroleum products, and electricity.
Additionally, in specified areas, the Board has regulatory responsibilities for oil and gas exploration and production activities under the National Energy Board Act, Canada Oil and Gas Operations Act (COGOA), the Canada Petroleum Resources Act (CPRA), and the North West Territories’ Oil and Gas Operations Act (OGOA) and Petroleum Resources Act (PRA). For oil and natural gas exports, the Board’s role is to evaluate whether the oil and natural gas proposed to be exported is surplus to reasonably foreseeable Canadian requirements, having regard to trends in the discovery of oil or gas in Canada. The Board monitors energy markets, and assesses Canadian energy requirements and trends to support these responsibilities under Part VI of the National Energy Board Act. This report, Canadian Energy Dynamics: Highlights of 2015, examines how elements of Canadian energy markets changed in 2015. It is one of a series of publications on energy supply, demand, and infrastructure that the NEB publishes regularly as part of its ongoing market monitoring.
Contributors to this report include: Ryan Creighton (project manager and NGLs); Chris Doleman (NGLs); Matthew Hansen (energy consumption); Darcy Johnson (crude oil); Mike Johnson (crude oil); Natalia Lis (LNG and electricity); Kayla Lund (gasoline); Amanda McCoy (document coordination); Connor McDonald (natural gas); Michael Nadew (project manager and electricity); Andrea DeCarle (natural gas); Christian Rankin (crude oil); Jesus Rios (crude oil and gasoline); Bryce Van Sluys (GHGs); and Cassandra Wilde (natural gas).
Questions or comments? Email EnergyDynamics@cer-rec.gc.ca
- Date modified: