Market Snapshot: Comparing Canada’s Energy Demand Trends in Alternative Energy Futures
Connect/Contact Us
Please send comments, questions, or suggestions for Market Snapshot topics to snapshots@cer-rec.gc.ca
Release date: 2021-02-10
Following the annual release of our Canada’s Energy Future 2020: Energy Supply and Demand Projections to 2050 (EF2020), the CER is publishing a series of Market Snapshots that look in greater depth at some of the key outcomes and topics of interest to Canadians.
This snapshot compares the energy use and electricity generation outcomes of the two scenarios in EF2020. These two scenarios differ based on the level of future action, in Canada and around the world, to reduce greenhouse gas (GHG) emissions. The Evolving Scenario considers the impact of continuing to increase global action on climate change to 2050. In contrast, the Reference Scenario considers a future where action to reduce GHG emissions does not develop beyond measures currently in place. More information on the assumptions underpinning these scenarios is available in the Scenarios and Assumptions section of EF2020.
Following the recovery from the COVID-19 pandemic, the Evolving Scenario projects total energy use to decline until 2050. This decline is due to several key factors, including improved energy efficiency of technologies, gradual electrification of the transportation sector, and various policies such as carbon pricing. In the Reference Scenario, lack of additional climate policy action beyond current policies, and less electrification, lead to moderate overall demand growth in the projection (although at levels lower than recent history).
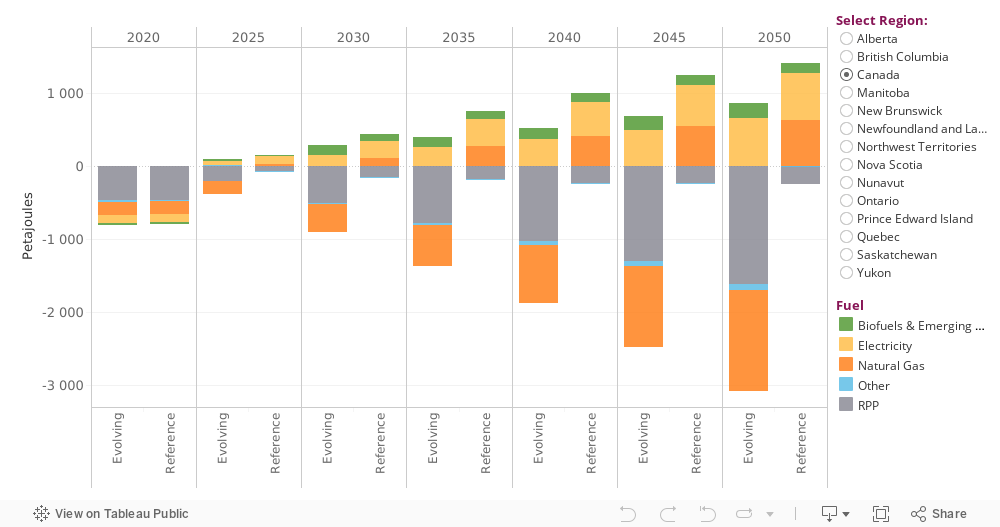
The mix of energy sources Canadians use will continue to change over time (see Figure 1). This change is more substantial in the Evolving Scenario, where demand for fossil fuels substantially decreases over time (in particular, refined petroleum products (RPPs), like gasoline and diesel). In contrast, the Reference Scenario sees demand for RPPs only slightly decreasing to 2050.
Figure 1. Changes in End-use Energy Demand, Relative to 2019
Source and Description
Source: CER
Description: This bar chart shows changes in end-use energy demand relative to 2019 for the years 2020, 2025, 2030, 2035, 2040, 2045, and 2050 for the following fuel categories: Biofuels and Emerging Energy, Electricity, Natural Gas, Refined Petroleum Products, and Other. These are shown at the national level, and for each province and territory.
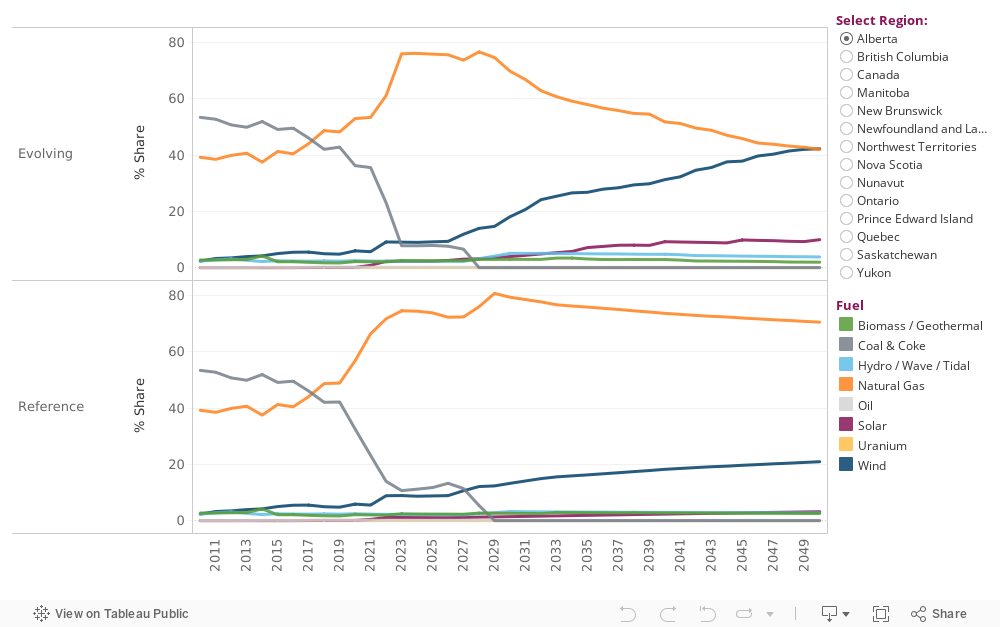
In both scenarios the use of electricity increases over time. By 2050, end-use demand for electricity increases by about 30% compared to 2019 in both scenarios. Importantly, the fuel mix used to generate that electricity will shift over time toward low-carbon sources of energy. However, the rate of this change is different between the Reference and Evolving Scenarios. In the Evolving Scenario, the share of electricity generated by burning fossil fuels shrinks over time compared to the Reference Scenario in all regions. To illustrate this point, Figure 2 shows shares of fuels used to generate electricity in different regions, for both the Evolving and Reference Scenario.
Figure 2. Shares of Fuels Used to Generate Electricity, Evolving and Reference Scenarios
Source and Description
Source: CER
Description: This time series chart shows primary fuels used for electricity generation at the national level, and in each province or territory, from 2010 to 2050.
Electricity generation from renewable resources grow in both scenarios, but more quickly in the Evolving Scenario. At the national level, wind and solar increase their share to about 27% of generation by 2050 in the Evolving Scenario, and about 17% in the Reference Scenario. In the Evolving Scenario, wind surpasses natural gas generation by the mid-2030s, but remains below gas generation through to 2050 in the Reference Scenario. However, this aggregation hides more significant trends in regional grid generation mixes. For example, in Alberta, Saskatchewan, and Nova Scotia, renewables grow much more quickly than the national average, as coal and natural gas powered generating capacity retires.
You can explore EF2020 electricity generation projections in greater detail by checking out our data visualization tool.
- Date modified: