Market Snapshot: Highlights from Canada’s Energy Future 2020
Connect/Contact Us
Please send comments, questions, or suggestions for Market Snapshot topics to snapshots@cer-rec.gc.ca
Release date: 2020-11-25
Canada’s Energy Future 2020: Energy Supply and Projections to 2050 (EF2020) is the latest long-term energy outlook from the Canada Energy Regulator (CER). The Energy Futures series explores how possible energy futures might unfold for Canadians over the long term, using economic and energy models to make these projections. Projections are based on assumptions about future trends in technology, energy and climate policies, energy markets, human behaviour, and the structure of the economy.
In the long term, global and Canadian ambition to reduce greenhouse gas (GHG) emissions will be a critical factor in how energy systems evolve. EF2020 considers two main scenarios, where energy supply and demand projections differ based on the level of future action to reduce GHG emissions:
- The Evolving Scenario, on which we focus throughout E2020, considers the impact of continuing the historic trend of increasing global action on climate change throughout the projection period.
- The Reference Scenario considers a future where action to reduce GHG emissions does not develop beyond measures currently in place.
Near-term Impacts of COVID-19
Although the Energy Futures series focuses on the long term, the COVID-19 pandemic has created significant near-term uncertainty about energy supply and demand trends. Because of this, EF2020 includes more focus on the near term than is typical of the Energy Futures series.
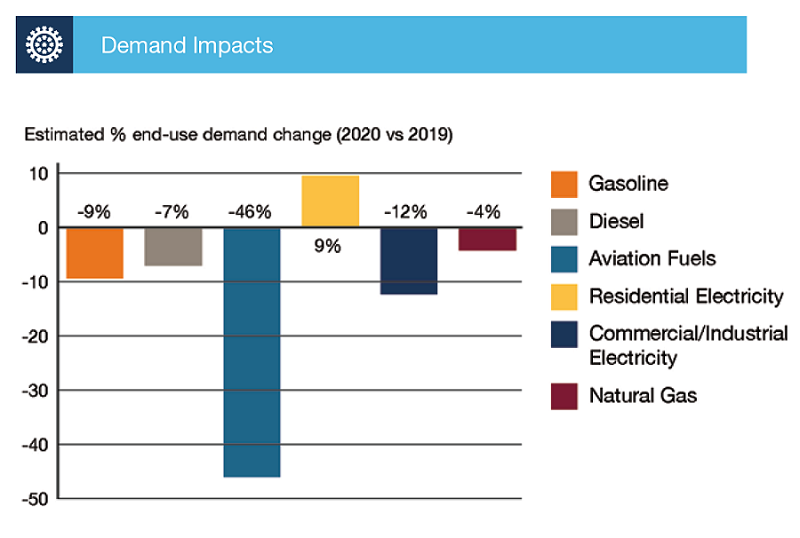
The COVID-19 pandemic has had a significant impact on Canadian energy use and production. Actions such as travel restrictions, increased work from home, and the broader economic impacts of the pandemic affect the energy system in various ways. Energy required to move people and goods decreases the most due to less travel and increased remote work and learning. Industrial energy use will also decrease as many industries have scaled back in response to lower demand for their goods. Energy use in the commercial sector will fall because of lower occupancy of buildings like offices, restaurants, and schools, while residential energy use increases as people spend more time in their homes.
Figure 1. Projected % Change in Energy Use, 2019 to 2020
Source and Description
Source: EF2020
Description: This chart gives an estimation of percent change from 2019 to 2020 in energy end-use demand for six fuel types. Relative to 2019, demand for gasoline in 2020 decreased by 9%, diesel fuel by 7%, aviation fuels by 46%, commercial and industrial electricity by 12%, and natural gas by 4%. Conversely, demand for residential electricity is estimated to increase by 9%.
Although energy demand trends changed significantly in response to the pandemic, electricity demand remained relatively stable. Daytime electricity levels flattened with increased residential electrical demand during peak stay-at-home periods.
In western Canada almost 1 million barrels per day (MMb/d) of oil production was shut-in by mid-May due to low prices. Some production has come back online with rising prices. Natural gas prices were rising before the pandemic in western Canada, keeping natural gas production in 2020 similar to 2019.
Long-term Trends Vary Significantly across Scenarios
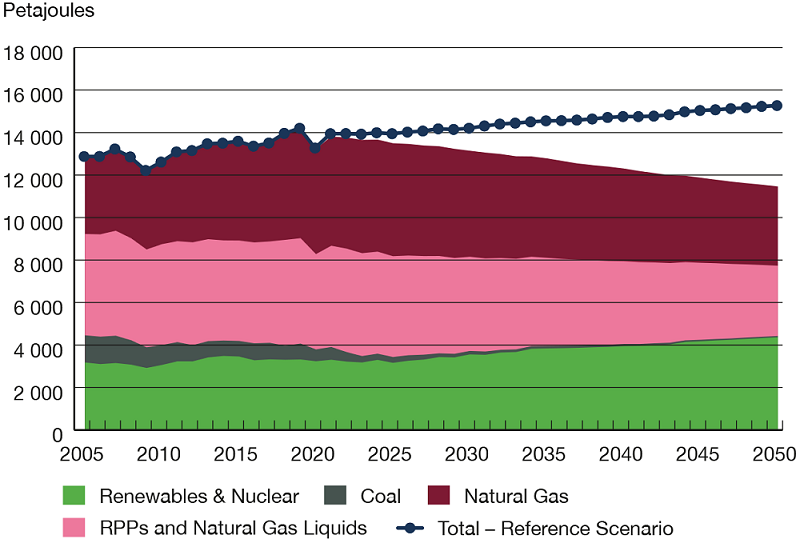
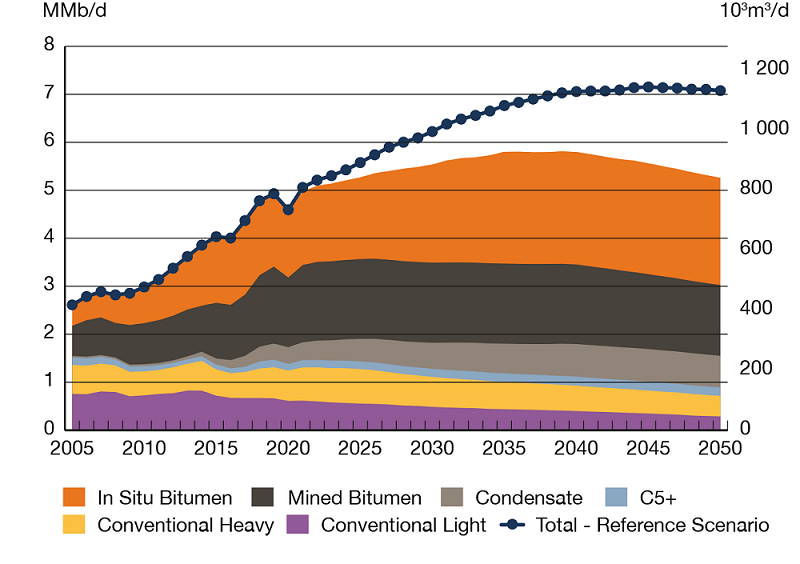
Over the long term, Canada’s domestic fossil fuel consumption remains below 2019 levels throughout the Evolving Scenario, while renewables and nuclear grow and become a larger share of the energy mix. Canadian crude oil production increases steadily, until peaking in 2039 in the Evolving Scenario. In this scenario, in situ production accounts for 43% of all crude oil production by 2050.
Figure 2. Primary Energy Demand
Source and Description
Source: EF2020
Description: This chart breaks down primary energy demand in the Evolving Scenario, by fuel, throughout the projection period. Coal demand decreases from 660 petajoules (PJ) in 2018 to 60 in 2050. Refined petroleum product (RPP) and natural gas liquids (NGL) demand decreases from 4 983 PJ in 2018 to 3 310 PJ in 2050. Natural gas demand decreases from 5 016 PJ in 2018 to 3 732 PJ in 2050. Hydro demands increase from 1 375 PJ in 2018 to 1 647 in 2050. Nuclear demands increase from 1 052 PJ in 2018, to 1 073 in 2050. Renewable demands increase from 878 PJ in 2018, to 1 643 in 2050. Total primary demand in the Evolving Scenario decreases from 13 964 PJ in 2018, to 11 467 in 2050, compared to an increase to 15 273 PJ in the Reference Scenario.
Figure 3. Crude Oil Production
Source and Description
Source: EF2020
Description: This graph shows crude oil production by type from 2005 to 2050 in the Evolving Scenario, and total production for the Reference Scenario. Canadian crude oil production in the Evolving Scenario peaks at 5.8 MMb/d in 2039 and declines to 5.3 MMb/d in 2050, an increase of 7% from 2019. For comparison, production peaks at 7.2 MMb/d in 2045 in the Reference Scenario.
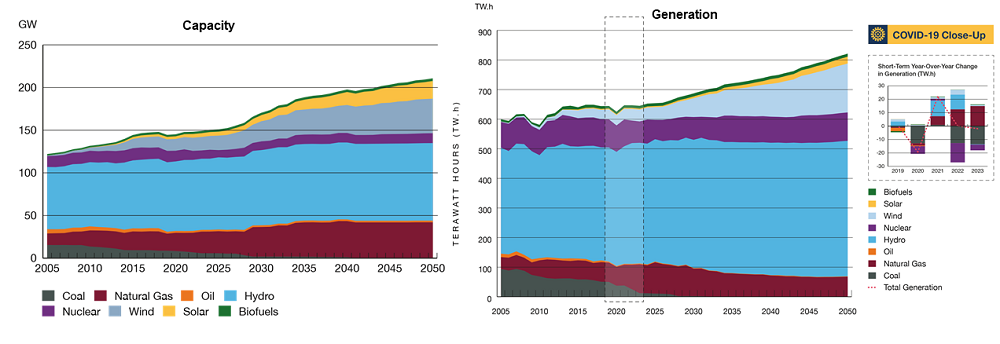
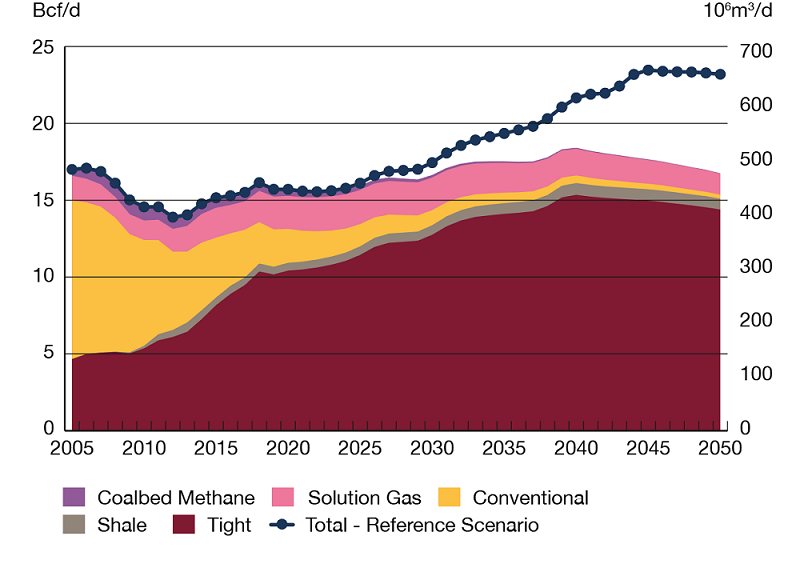
Electricity’s share of end-use demand increases in the Evolving Scenario, as half of all passenger vehicle sales are projected to be electric by 2050. The share of renewable electricity generation sources, like wind and solar, continue to grow. Driven by global demand for liquefied natural gas (LNG), Canadian natural gas production increases and peaks in 2040 in the Evolving Scenario. In this scenario, tight gas accounts for 86% of total gas production by 2050.
Figure 4. Electricity, Installed Capacity and Generation
Source and Description
Source: EF2020
Description: This chart shows electricity generation capacity by fuel type for the Evolving Scenario. It increases from 145 gigawatts (GW) in 2019 to over 200 GW in 2050. Renewable and natural gas capacity is added, while coal is phased out. Another stacked bar shows electricity generation by fuel type for the Evolving Scenario. It increases from 645 terawatt hours (TW.h) in 2019 to over 820 TW.h in 2050. Renewable and natural gas generation is added, while coal is phased out.
Figure 5. Natural Gas Production
Source and Description
Source: EF2020
Description: This graph shows natural gas production by type from 2005 to 2050 in the Evolving Scenario, and total production for the Reference Scenario. Total production in 2005 was 17.0 billion cubic feet per day (Bcf/d), with tight and shale gas production at 4.7 Bcf/d. In 2050, total gas production is 16.8 Bcf/d in the Evolving Scenario, with tight and shale gas making up the majority of production at 15.1 Bcf/d. In the Reference Scenario, total gas production reaches 23.2 Bcf/d in 2050.
Towards Net-Zero
While fossil fuel consumption declines in the Evolving Scenario, it still makes up over 60% of Canada’s fuel mix in 2050. Achieving net-zero GHG emissions by 2050 will require an accelerated pace of transition away from fossil fuels. EF2020 includes a “Towards Net-Zero” section which explores some unique challenges and opportunities in pursuing deep decarbonization in Canada. It discusses what net-zero could mean for Canada, and focuses on three segments of the Canadian energy system: personal passenger transportation, oil sands production, and remote and northern communities. What the exact 2050 balance might be between removing and emitting GHGs into the atmosphere is not yet clear. What is clear is Canada’s likelihood of achieving our ambitious net-zero target increases as our energy system emissions fall.
Access and Explore Energy Futures Data
To dig deeper into the report, check out “Exploring Canada’s Energy Future” interactive data visualization tool, which has been refreshed for EF2020. For links to the data behind the report’s figures, customizable data tables, and the datasets in machine-readable format, see our “Access and Explore Energy Futures Data” section.
- Date modified: