Market Snapshot: Economics of Duvernay Shale
Release date: 2018-01-10
One billion barrels of oil, 12.0 trillion cubic feet (Tcf) of natural gas and 1.4 billion barrels of natural gas liquids are economicFootnote 1 in the Duvernay Shale according to a new report by the NEB. This means that at 2017 well costs and oil and gas pricesFootnote 2, about one third of the Duvernay’s marketableFootnote 3 oil resource is economic, along with 16% of its marketable natural gas resource and one fifth of its marketable NGL resource.
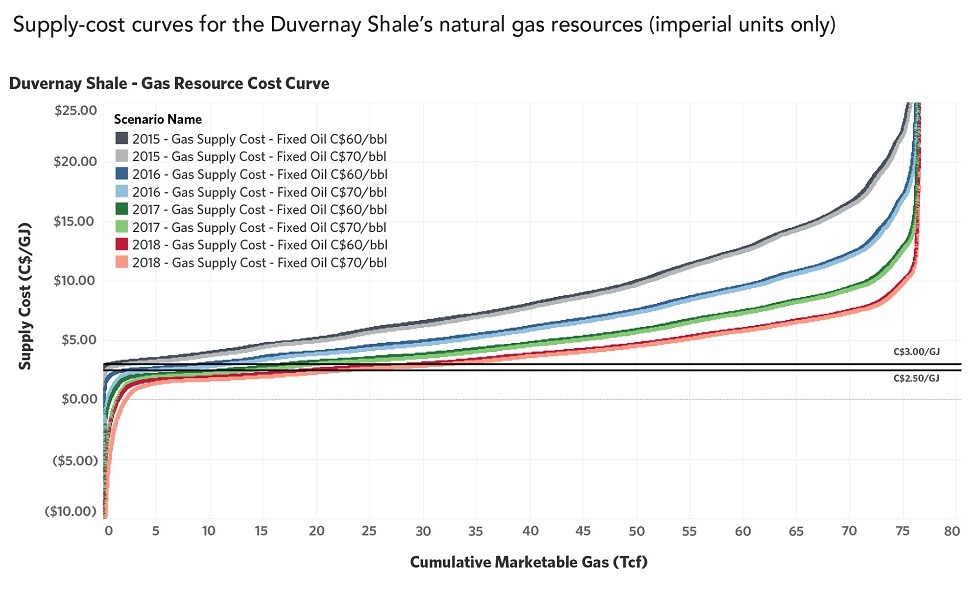
The NEB estimated supply costs for the Duvernay Shale’s marketable resources by determining the crude oil, natural gas and NGL prices required for a well to cover its costs and earn a 10% profit. The NEB report provides the details of supply costs calculation including the assumptions made and definitions used. The chart below shows the supply costs for the Duvernay Shale's marketable gas resource. The chart shows four sets of two curves. Each set represents a year from 2015 to 2018. The pairs in each set represent fixed oil prices of C$60 per barrel and C$70 per barrel.
Source and Description
Source: NEB
Description: This chart shows the supply costs in C$ per gigajoule for the Duvernay Shale's marketable gas resource. There are four sets of two curves. Each set represents a year from 2015 to 2018. The pairs in each set represent fixed oil prices of C$60 per barrel and C$70 per barrel. Supply costs are progressively lower with each year. Costs based on C$60 per barrel oil are slightly higher than $70 per barrel oil in each pair. Each cost curve gradually rises until it nears the 72 Tcf area. At this time the curve becomes much steeper as it approaches the total amount of marketable gas available of 76.6 Tcf.
Assuming well costs continue to decrease in 2018Footnote 4 and crude oil and natural gas prices modestly riseFootnote 5, the Duvernay’s economic resource would increase to become over 40% of its marketable natural gas resources, almost two thirds of its marketable oil resources, and over half of the Duvernay’s marketable NGL resources.
| Resources | Gas (Tcf) | Oil (billion barrels) | NGLs (billion barrels) | |||
|---|---|---|---|---|---|---|
| 2017 | 2018 | 2017 | 2018 | 2017 | 2018 | |
| Economic | 12.0 | 32.9 | 1.0 | 2.2 | 1.4 | 3.4 |
| Marketable | 76.6 | 3.4 | 6.3 | |||
Source and Description
Source: NEB
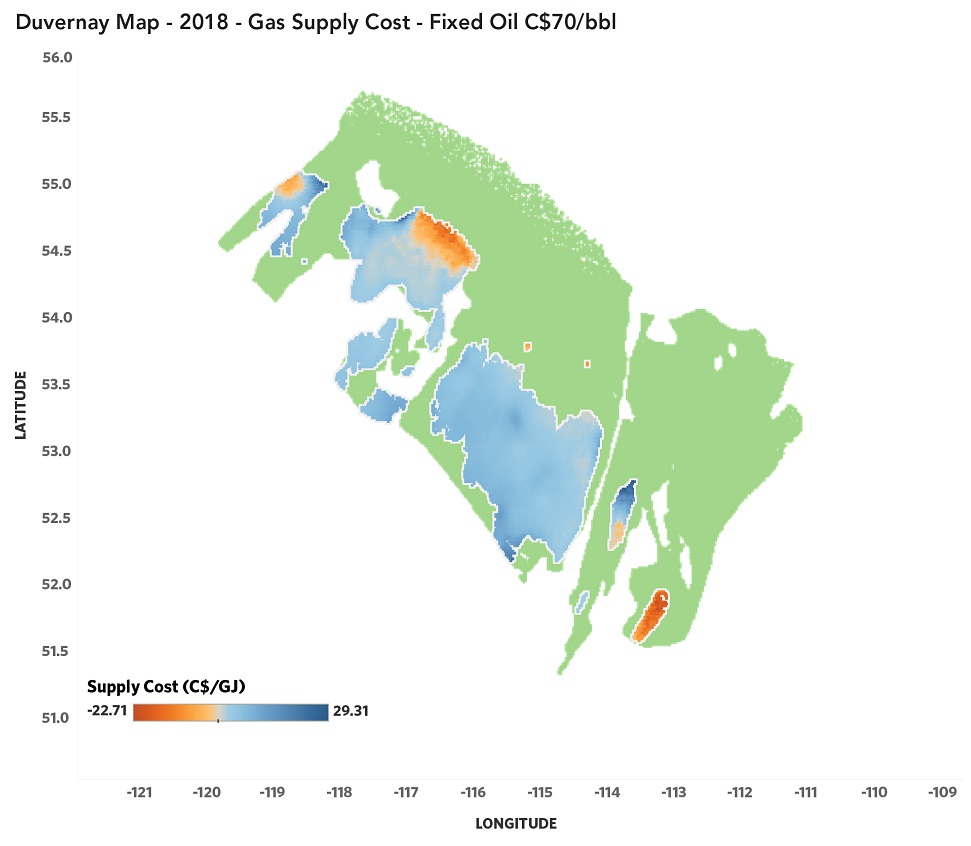
Description: This map plots the supply costs of the Duvernay Shale marketable gas resource over the study area (2018 well costs with oil prices fixed at C$70 per barrel). The marketable gas is most economic in pockets in the north central part of the Duvernay Shale basin and in pockets to the far southeast.
In the Duvernay Shale, some areas are economic even at negative gas prices. This indicates that, in those areas, companies earn enough revenue from oil and NGL production from a well that they can lose money on the natural gas production and still make a profit.
- Date modified: